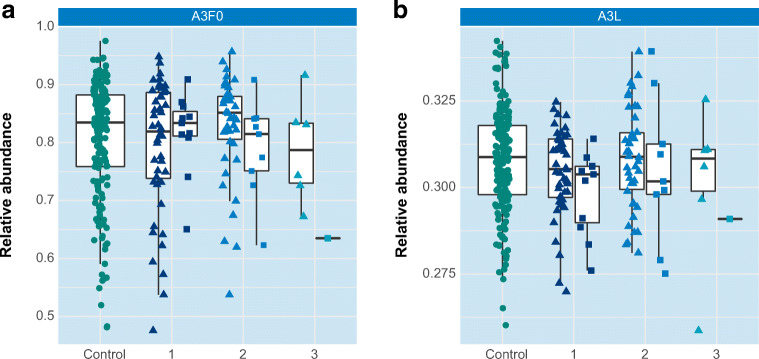
Fig. 4.
Two examples of derived traits and their potential association with cancer stage. Control individuals are plotted in green, breast cancer patients are plotted in blue with staging 1 = grade I, 2 = grade II, 3 = grade III. Breast cancer patients are further stratified according to histology, namely “Invasive ductal carcinoma” (triangles) and “Invasive lobular carcinoma” (squares) a Non-fucosylated triantennary glycans (A3F0) b α2-3-sialylated triantennary glycans (A3L)

