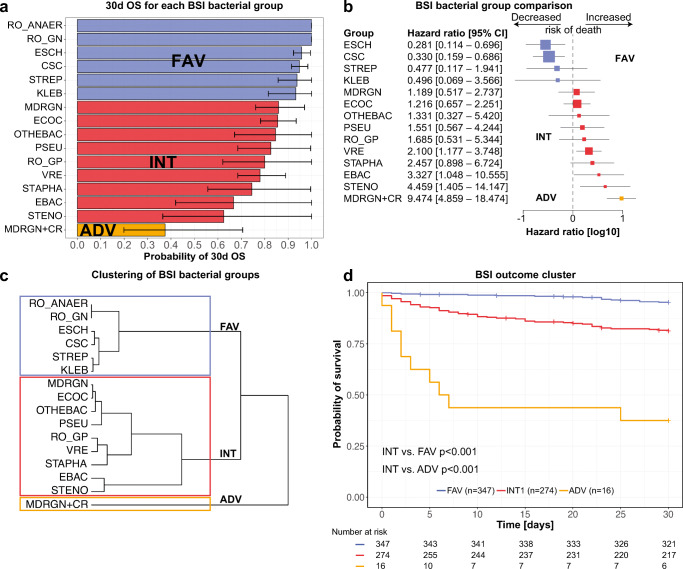
Fig. 3.
Bar chart showing 30d OS and 95% confidence intervals for BSI of different bacterial groups (a). Forest plot depicting hazard ratios for 30d mortality and 95% confidence intervals comparing each BSI group to all others showing all BSI groups with at least one event of death (b). Dendrogram clustering the BSI bacterial groups depending on their 30d OS into three clusters by hierarchical cluster analysis using Ward’s method (c). Kaplan-Meier plot showing 30d OS for BSI episodes according to the classification into three clusters (d). Colors indicate the affiliation of the groups to the three clusters

