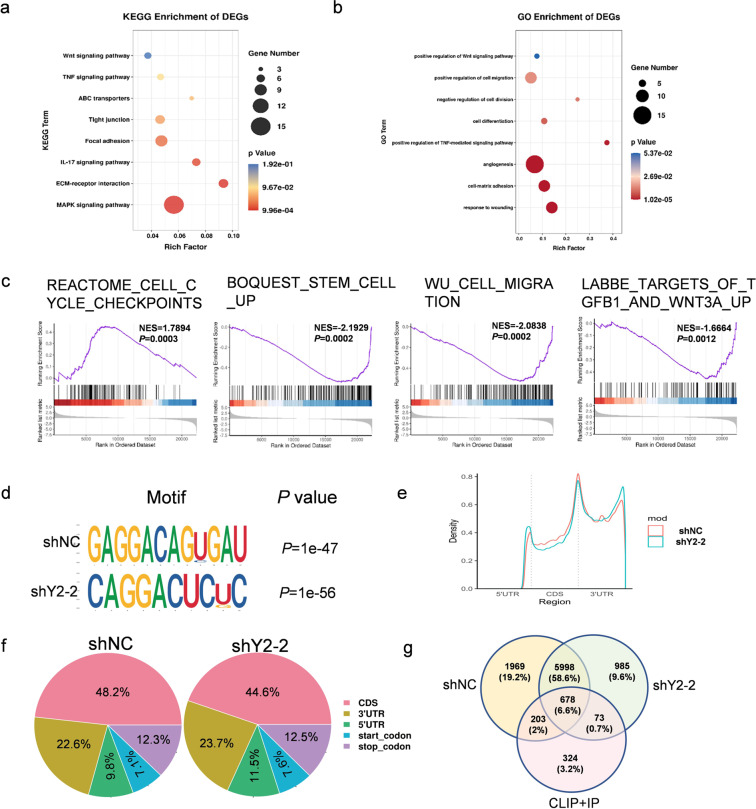
Fig. 4. Identification of YTHDF2 targets via MeRIP-seq and RNA-seq in LUAD.
a, b KEGG and GO enrichment analysis of differentially expressed genes (DEGs) identified by RNA-seq. c GSEA plots showing that the pathways of DEGs altered by YTHDF2 knockdown were involved in LUAD. d m6A motif detected by the HOMER motif analysis with m6A-seq data in A549 cells with or without YTHDF2 knockdown. e Metagene profiles of m6A enrichment across the mRNA transcriptome in LUAD. f Graphs of m6A peak distribution showing the proportion of total m6A peaks in the indicated regions in control and YTHDF2-knockdown cells. g Venn diagram illustrating the overlapped targets of YTHDF2 in control and YTHDF2-knockdown cells identified by m6A-seq analysis and the targets identified by eCLIP and RIP.

