
Fig. 2. CBP/p300 HAT inhibition leads to reduced expressions of β and α identity genes.
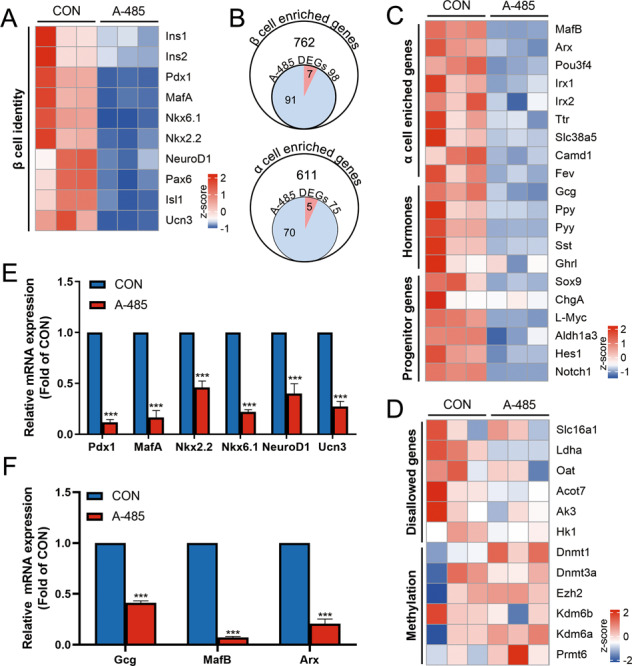
A Heatmap of β cell identity genes. B Venn diagrams of upregulated (red) and downregulated (blue) genes enriched in β and α cell by A-485 treatment. C Heatmap of α cell identity genes, islet hormone genes, and progenitor markers. D Heatmap of disallowed genes and related methylases and demethylases. E–F Isolated rat islets were treated with 3 μM A-485 for 16 h and mRNA levels of β and α cell identity genes were detected by RT-qPCR. Data are given as mean ± SD for three separate experiments. ***p < 0.001 vs control group.