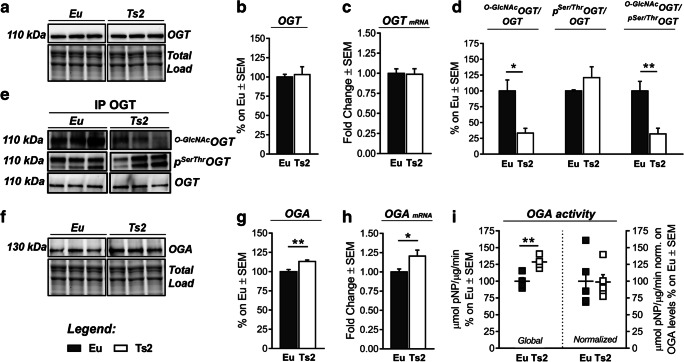
Fig. 4.
Reduced O-GlcNAcylation rely on aberrant OGT/OGA cycling. (A–C) Analysis of OGT protein levels and transcript in Ts2 mice compared to respective euploids. OGT showed no alteration neither in protein expression nor in mRNA levels in Ts2 hippocampus compared to the control group. Representative blot is reported in (A). (D–E) Evaluation of OGT’s PTMs by immunoprecipitation analysis. A significant reduction in O-GlcNAcOGT/OGT levels together with a trend of increase in its pSer/ThrOGT/OGT levels was observed in Ts2 mice compared to the respective euploid group. Representative blots are reported in (E). (F–H) Analysis of OGA protein levels and transcript in Ts2 mice compared to respective euploids. Both OGA protein and mRNA levels were found significantly increased Ts2 mice in comparison to the respective control group. Representative blot is reported in (F). (I) OGA activity assay. Global OGA activity is significantly increased in Ts2 mice compared to the respective control group. However, the enzyme-specific hydrolytic activity of OGA obtained through normalization on respective protein levels does not show relevant changes in the two groups. Number of animals for each condition was as follows: n = 6/group for western blot and RT-qPCR, n = 4/group for immunoprecipitation analysis, and n = 5/group for OGA activity assay. All bar charts reported in (B), (C), (D), (G), (H), and (I) show mean ± SEM. *p < 0.05, **p < 0.01, using Student’s t test

