Fig. 3.

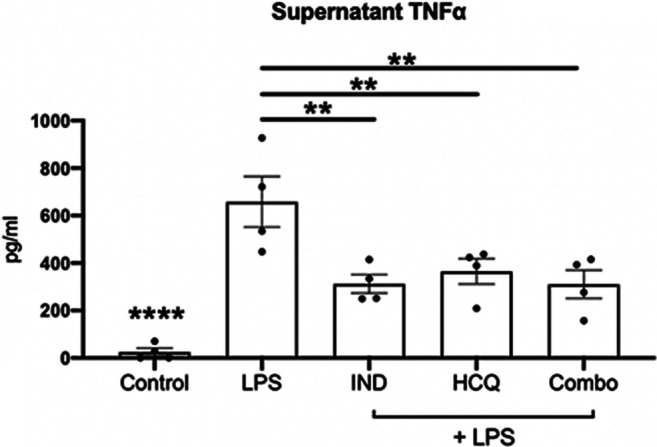
Drug treatments alone and in combination reduce TNF-α levels in vitro. Representative data from supernatant collected from cultured mouse microglia which were stimulated with 10 ng/ml LPS and subsequently subjected to drug treatments of 5 μM HCQ, 1 μM indapamide, and their combination. Supernatant was analyzed for TNF-α with an ELISA. Bar graphs display the mean with error bars representing the SEM. Data were analyzed using a one-way ANOVA with Dunnett’s post hoc multiple comparison test against the 10 ng/ml LPS group. Data has been reproduced with similar trends in two other experiments. Each data point represents one replicate well. **p < 0.01, ****p < 0.0001 compared to LPS. IND: indapamide, HCQ: hydroxychloroquine
