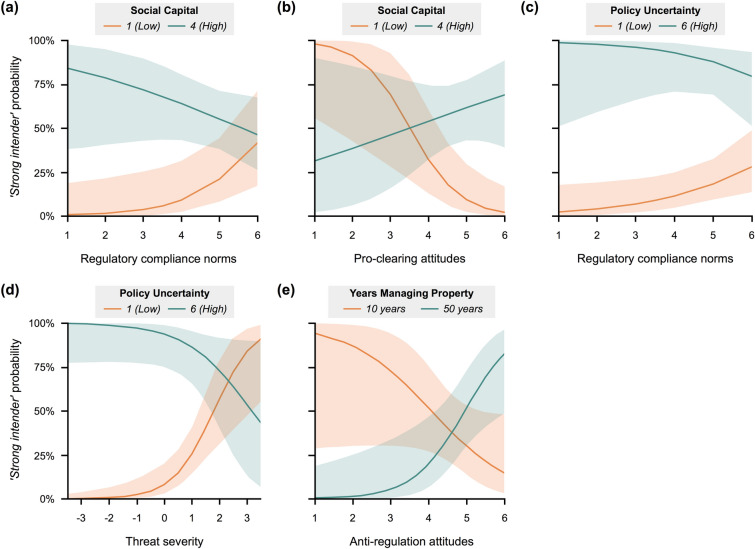
Fig. 3.
Predicted probabilities of a land manager having strong intentions to clear trees in the next 6 months based on the interactions between a social capital and compliance norms, b social capital and pro-clearing attitudes, c policy uncertainty and compliance norms, d policy uncertainty and threat appraisal (severity) of the clearing regulations, and e years managing their property and anti-regulation attitudes. Shaded areas represent the 95% confidence interval around the mean predicted probability. Interaction effects are strongest when confidence intervals are smallest and when confidence intervals of higher (green) and lower (red) values are farthest apart; effects become insignificant at the point when confidence intervals overlap

