Fig. 7.
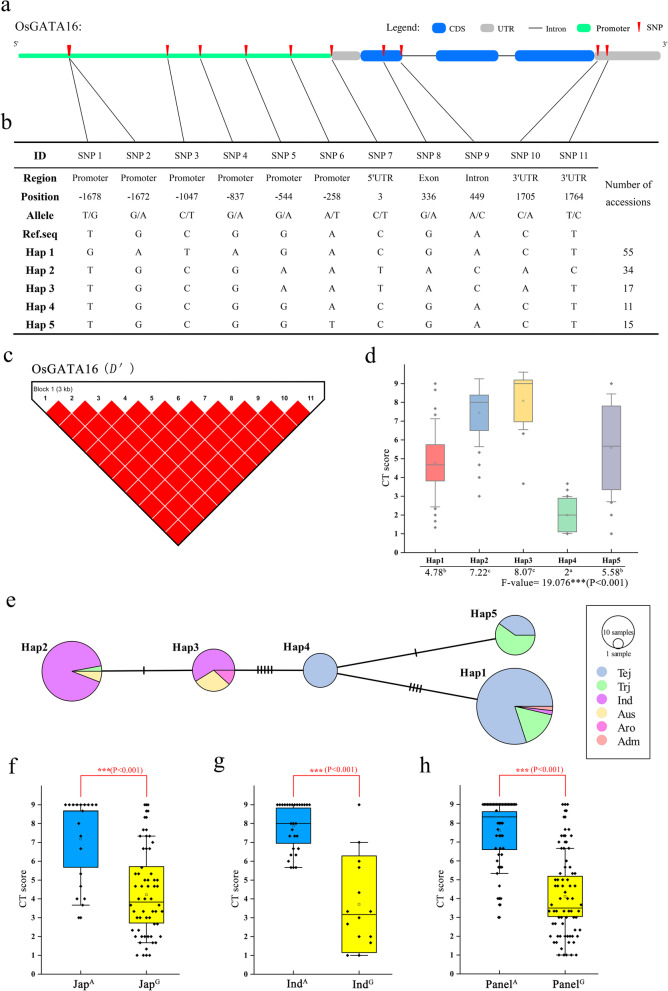
Haplotype analysis of OsGATA16. a Structural representation of OsGATA16 and upstream promoter region. b OsGATA16 SNPs and haplotype groups in 137 rice accessions. SNP positions are given relative to the start of the 5′UTR. Hap: haplotype (c) Linkage disequilibrium (LD) analysis of OsGATA16. The eleven SNPs shown in (b) were used for LD block assessments, with SNP numbers as in (b). D′ was used for evaluation of LD. Red indicates complete linkage equilibrium between each SNP. d Relationship of cold-tolerant phenotype with haplotype. Cold-tolerance (CT) score is on a 1–9 scale, with 1 representing highest CT. Different letters indicate significant CT differences among haplotypes (ANOVA, Duncan test) (e) Haplotype network variation. Circle size represents the number of accessions in each Hap, and the number of transverse lines between each Hap represents the number of nucleotide variations. Tej, temperate japonica; Trj, tropical japonica; Ind, indica; Aus, aus; Aro, aromatic; and Adm, admixture rice varieties. f-h SNP 8 haplotype relationship with CT. Superscript A and G indicate the A and G genotypes in japonica (f), indica (g), and japonica plus indica (h) accessions. Asterisks indicate significant differences in CT between genotypes (Student’s t-test, ***p < 0.001)

