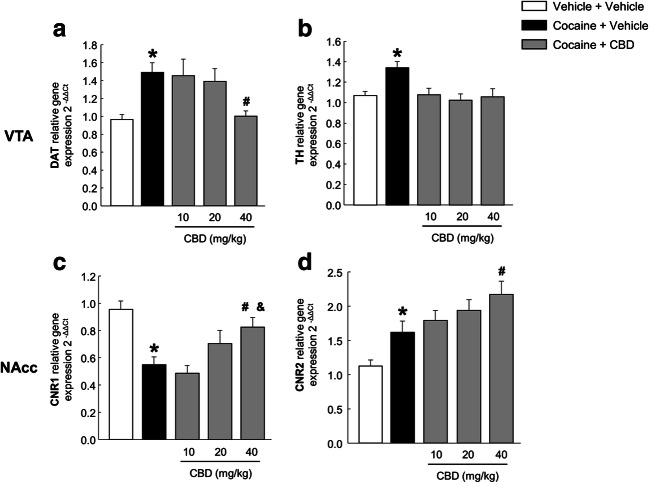
Fig. 4.
Relative gene expression analyses of dopamine transporter (DAT) (A) and tyrosine hydroxylase (TH) in the ventral tegmental area (VTA) (B), and cannabinoid receptors 1 (CNR1) (C) and 2 (CNR2) (D) in the nucleus accumbens (NAcc). Columns represent the means and vertical lines ± SEM of 2−ΔΔCt. *, values from COCA-VEH-treated group that are significantly different from VEH-VEH-treated group (one-way ANOVA, P < 0.01). #, values from COCA-CBD-treated group that are significantly different from those treated with COCA-VEH (one-way ANOVA, P < 0.05). &, values from COCA-CBD (40 mg/kg)-treated group that are significantly different from groups treated with COCA-CBD (10 mg/kg) (one-way ANOVA, P < 0.01). Number of mice per group n = 8–10

