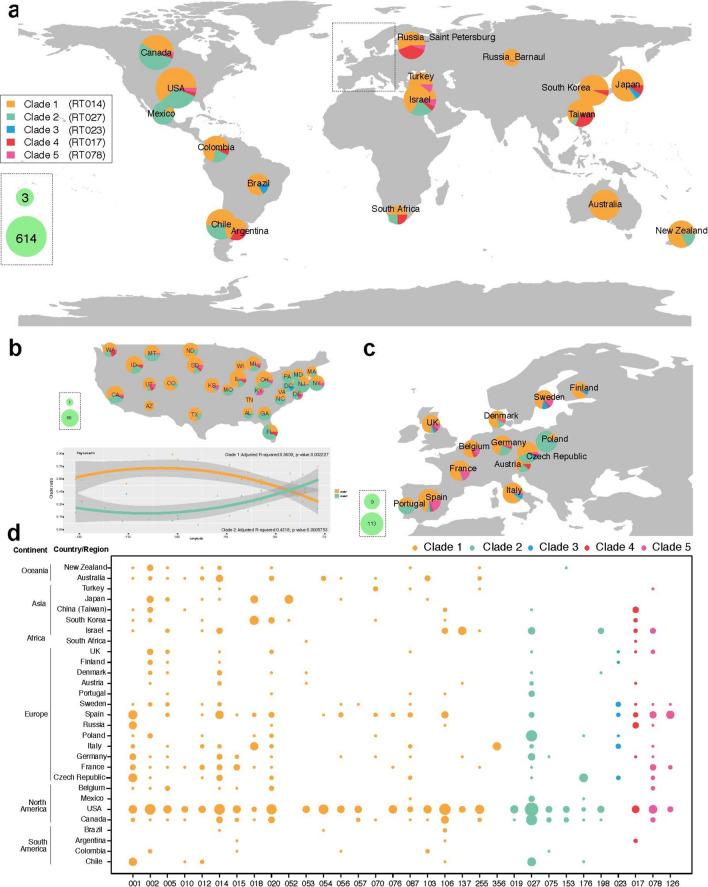
Fig. 3.
Geographic distribution of ribotypes and clades. In panels a, b, and c, each pie chart represents a collection of isolates from a region (country/province/city). The size of the pie chart corresponds to the sample size collected. The proportion of MLST clades is presented in each pie chart; the most predominant ribotype in each clade is provided in parentheses in the color key. The panels show: a global prevalence data; b prevalence data for individual states in the USA; c prevalence data for individual European countries (except Russia). In panel d, the size of the circles corresponds to the number of isolates collected. MLST multi-locus sequence typing

