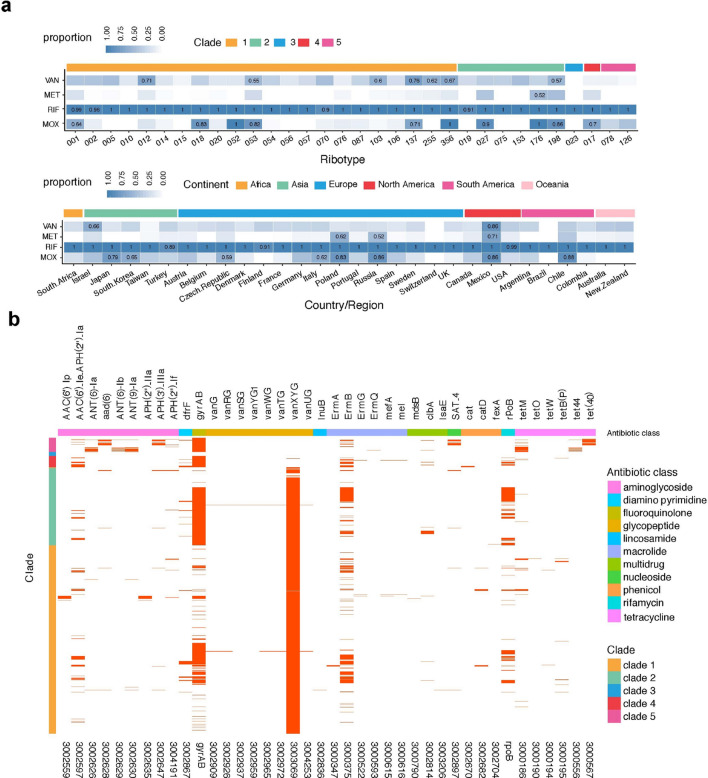
Fig. 4.
Prevalence of resistance based on in-vitro data (MIC) and in silico prediction (CARD). a Reduced antibiotic susceptibility/resistance rate across ribotypes, clades, and geographic region. Heatmap of proportions of antibiotic-reduced susceptibility/resistant samples for VAN, MET, RIF, and MOX are plotted from top to bottom against ribotypes, color-coded according to clade or continent of sampling; values are shown for proportions > 0.5. b The presence of resistance determinants, identified using the Comprehensive Antibiotic Resistance Database and literature reports, is indicated with a red line. The resistance determinants are indicated by gene name (top) and Antibiotic Resistance Ontology accession number (bottom), and the corresponding antibiotic class and clade are indicated by the color-coded X and Y axes, respectively. The heatmaps represent the proportions of antibiotic-reduced susceptibility/resistant samples; values are shown for proportions > 0.5. EUCAST European Committee on Antimicrobial Susceptibility Testing, MET metronidazole, MIC minimum inhibitory concentration, MOX moxifloxacin, RIF rifaximin, VAN vancomycin

