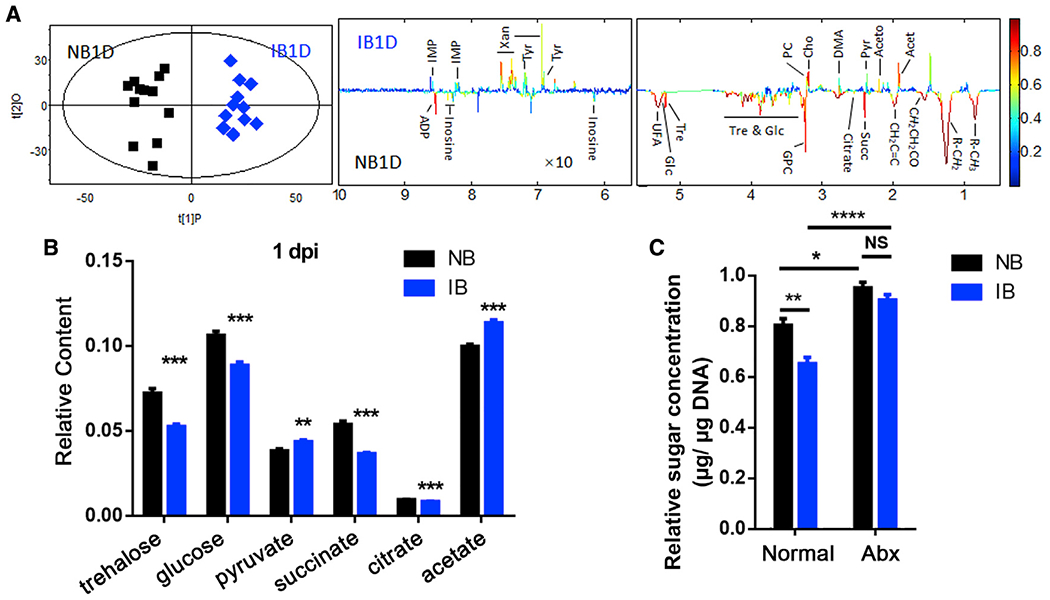
Figure 1. P. berghei infection changes glucose metabolism in An. Stephensi.

(A) OPLS-DA score plots (left) and corresponding loading plots (right) show the metabolites significantly changed in the extract from mosquitoes fed on normal blood (NB) and infectious blood (IB) at 1 day post-infection (1 dpi). R2X = 0.430, Q2 = 0.857. Metabolite keys are the same as in Table S1.
(B) Relative content of the key sugar metabolites. All of the integral regions were normalized to dried weight of mosquitoes for each spectrum.
(C) The relative concentrations of total sugar levels (glucose and trehalose) in the midgut of mosquitoes treated without (Normal) or with antibiotics (Abx) 1 dpi. Glucose and trehalose concentrations were normalized to genomic DNA extracted from the midgut.
Significance in (A) was determined by a cross-validated ANOVA (CV-ANOVA) approach with p < 0.05 as the significance level. Significance in (B) was determined by Student’s t test. Significance in (C) was determined by ANOVA with Tukey test. Error bars indicate SEM (n = 5). NS, not significant, *p < 0.05, **p < 0.01, ***p < 0.001, ****p < 0.0001. See also Figure S1.
