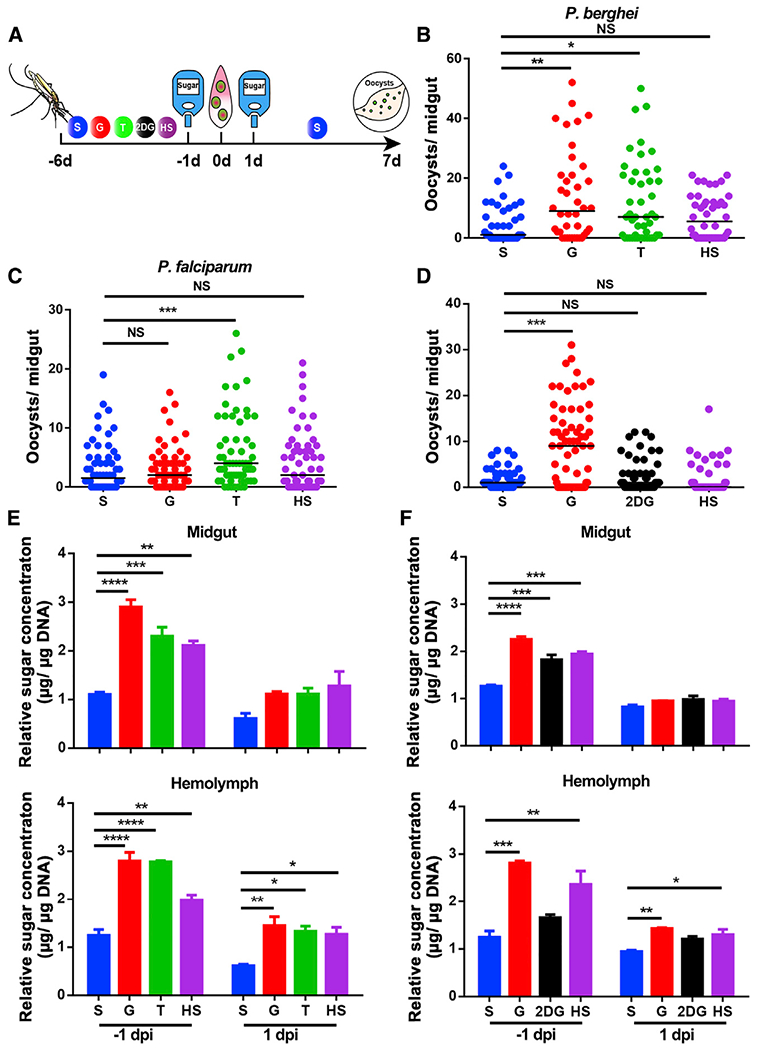
Figure 2. Glucose and trehalose supplementation promote Plasmodium infection in An. Stephensi.

(A) Workflow of sugar treatment on Anopheles mosquitoes.
(B and C) P. berghei and P. falciparum oocyst intensities in mosquitoes fed with S, G, T, and HS diets.
(D) P. berghei oocyst intensity in mosquitoes fed with S, G, 2-DG, and HS diets.
(E and F) The relative concentration of total sugar (glucose and trehalose) in the midgut (top) and hemolymph (bottom) of mosquitoes fed on the sugar diets corresponding to (B) and (D), respectively, one day prior to infection (−1 dpi) and 1 dpi. Glucose and trehalose concentrations were normalized to the amounts of genomic DNA extracted from midgut and hemolymph, respectively.
Each dot represents an individual mosquito, and horizontal lines represent the medians. Results shown in (B)–(D) were pooled from at least two independent experiments. Significance was determined by ANOVA with Dunn’s tests. Significance in (E) and (F) was determined by ANOVA with Dunnett tests. Error bars indicate SEM (n = 5). *p < 0.05, **p < 0.01, ***p < 0.001, ****p < 0.0001. S, 2% sucrose; G, 2% sucrose + 0.1 M glucose; T, 2% sucose + 0.1 M trehalose; 2-DG, 2% sucrose + 0.1 M glucose + 5 mM 2-DG; HS, 10% sucrose. See also Figure S2.
