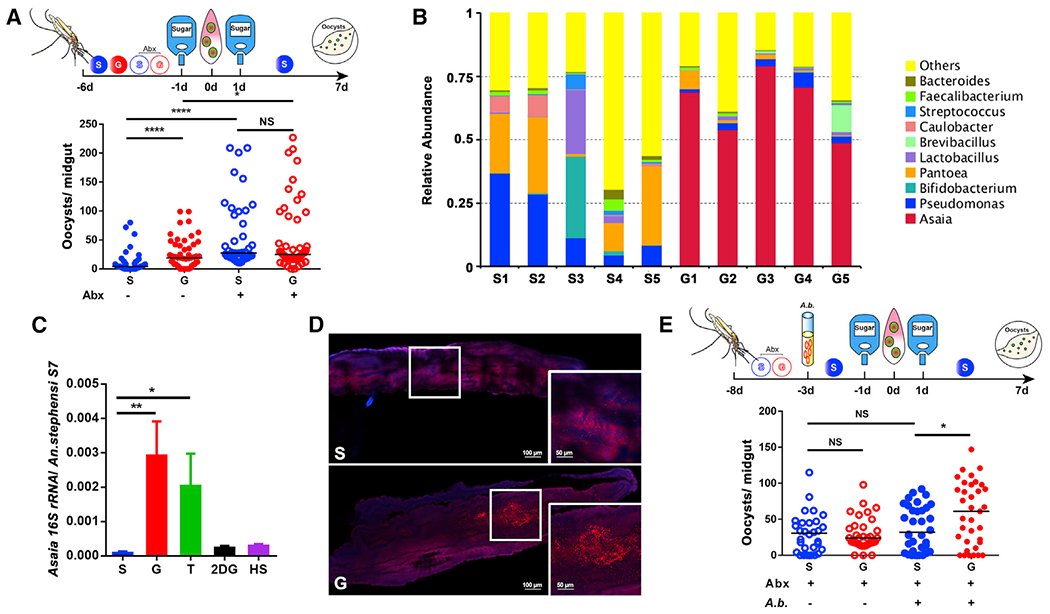
Figure 3. Asaia bogorensis promotes P. berghei infection in An. stephensi.

(A) Influence of antibiotics treatment on P. berghei infection.
(B) Relative abundance of major bacteria genera in the midguts of An. stephensi fed on S and G by 16S rRNA pyrosequencing. Each column represents three pooled midguts.
(C) The abundance of A. bogorensis in the midgut of An. stephensi determined by qPCR.
(D) Localization of A. bogorensis (red) in the midgut of An. stephensi fed on S and G, using A. bogorensis-specific probes. Nuclei were stained with DAPI (blue). The enlarged view in the box is shown on the right of the figure. Images are representative of at least five individual mosquito midguts.
(E) Influence of A. bogorensis re-colonization on P. berghei infection outcome.
Each dot represents an individual mosquito, and horizontal lines represent the medians. Results shown in (A) and (E) were pooled from two independent experiments. Significance was determined by ANOVA with Dunn’s tests. Significance in (C) was determined by ANOVA with Dunnett tests. Error bars indicate SEM (n = 12). NS, not significant, *p < 0.05, **p < 0.01, ****p < 0.0001. S, 2% sucrose; G, 2% sucrose + 0.1 M glucose; Abx, antibiotics treatment; A.b., A. bogorensis. See also Figure S3.
