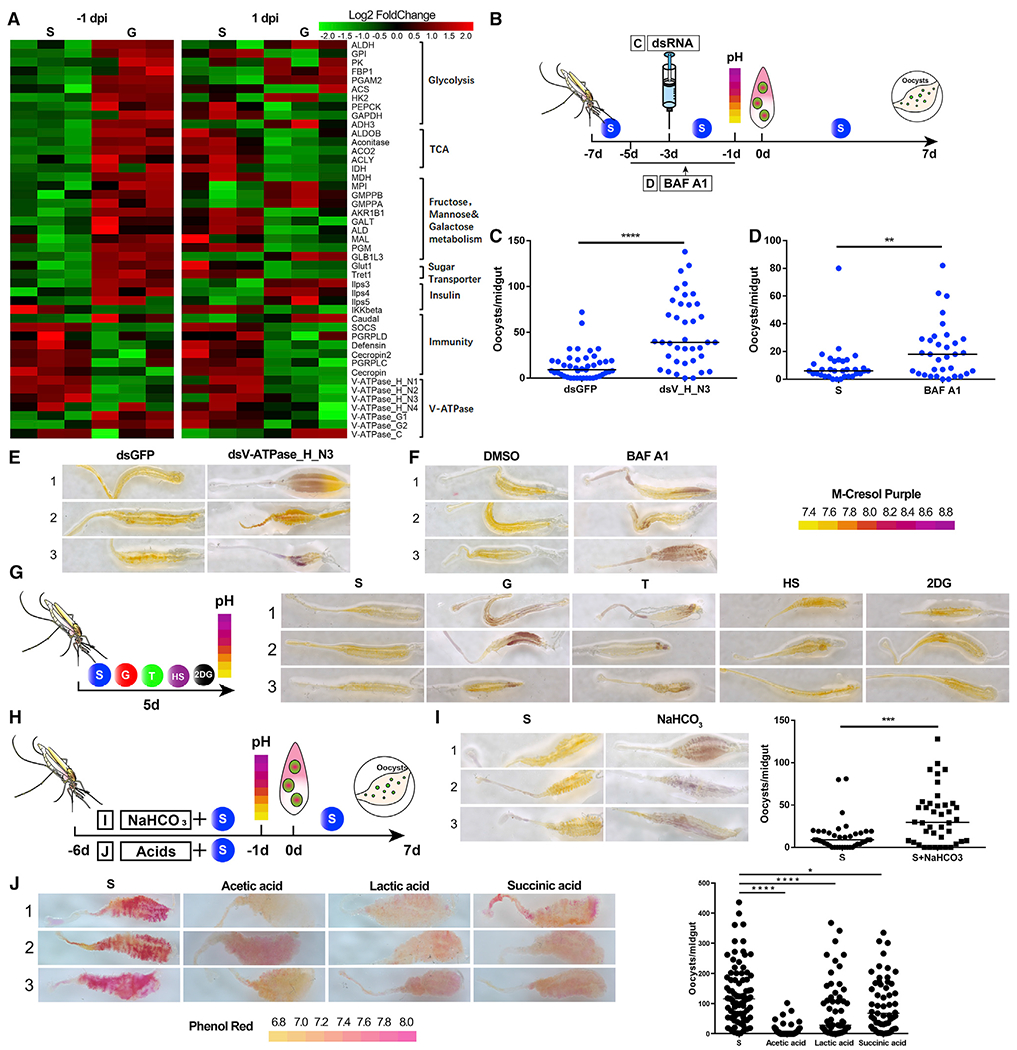
Figure 4. Midgut pH determines the susceptibility of An. stephensi to P. berghei infection.

(A) Hierarchical clustering analysis of differentially expressed genes in the midguts of mosquitoes fed with S and G at −1 dpi and 1 dpi. Upregulated genes are shown in red; downregulated genes are shown in green.
(B) Workflow of dsRNA injection (C) and BAF A1 treatment (D) in An. stephensi.
(C and D) P. berghei oocyst numbers in dsRNA (C) and BAF A1 (D) treatments.
(E and F) The pH staining of mosquito midguts treated with dsRNA (E) and BAF A1 (F) by pH indicator m-cresol purple. The pH indicator is shown on the right. Images are three representatives of at least five individual mosquito midguts.
(G) The pH staining of mosquito midguts fed on S, G, T, HS, and 2-DG diets by m-cresol purple. Workflow of pH assay of mosquitoes on S, G, T, HS, and 2-DG diets (left). The pH staining of midguts on different diets (right). Images are three representatives of at least five individual mosquito midguts.
(H) Workflow of NaCHO3 (I) and acids treatments (J) in An. stephensi.
(I) The effect of NaCHO3 supplementation on P. berghei infection. The pH staining of NaHCO3-fed midguts (left) and Plasmodium oocyst numbers after NaHCO3 treatment (right). Images are three representatives of at least five individual mosquito midguts.
(J) The effect of acid supplementation on P. berghei infection. The pH staining of midguts on different diets is shown by pH indicator phenol red (left). The pH indicator is shown at the bottom. The Plasmodium oocyst numbers after acid treatment are shown (right). Images are three representatives of at least five individual mosquito midguts.
Each dot represents an individual mosquito, and horizontal lines represent the medians. Data shown in (C), (D), (I), and (J) were pooled from two independent experiments. Significance was determined by Mann-Whitney test in (C), (D), and (I) and by ANOVA with Dunn’s tests in (J). *p < 0.05, **p < 0.01, ***p < 0.001, ****p < 0.0001. S, 2% sucrose; G, 2% sucrose + 0.1 M glucose; T, 2% sucrose + 0.1 M trehalose; 2-DG, 2% sucrose + 0.1 M glucose + 5 mM 2-DG; HS, 10% sucrose, NaCHO3, 2% sucrose + 0.1 M NaCHO3. See also Table S2 and Figure S4.
