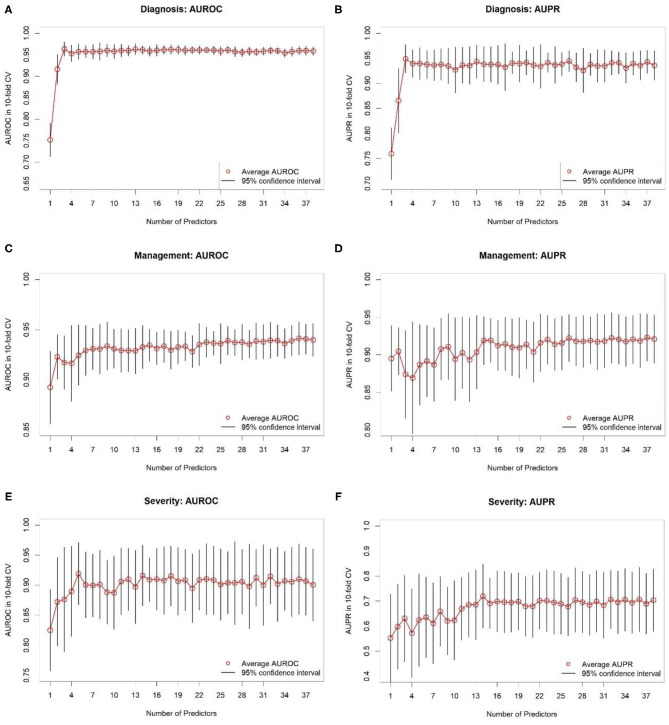
Figure 3.
Results of 10-fold cross-validation for random forest classifiers based on different numbers of predictor variables selected based on variable importance. (A,B) Show areas under receiver operating characteristic (AUROC) and precision-recall (AUPR) curves, respectively, for predicting diagnosis. (C,D) Show AUROCs and AUPRs, respectively, for predicting management. (E,F) Show AUROCs and AUPRs, respectively, for predicting severity. Black-colored bars correspond to 95% confidence intervals, constructed using t-distribution; red-colored dots correspond to averages. Recall that random classifier AUROCs are 0.50 for all three targets and random classifier AUPRs are 0.43, 0.38, and 0.12 for diagnosis, treatment, and complicated appendicitis, respectively.

