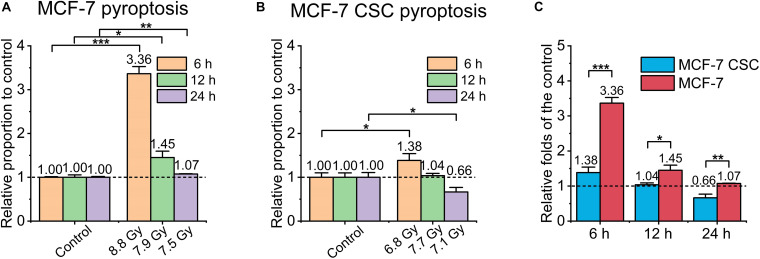
FIGURE 4.
Pyroptosis of irradiated MCF-7 cells and MCF-7 CSCs. (A,B) Compared with the relative controls, the increasement of pyroptosis proportion for irradiated groups at 6, 12, and 24 h, respectively. (C) The increasement of the pyroptosis proportion between irradiated MCF-7 cells and MCF-7 CSCs. *P < 0.05; **P < 0.01; ***P < 0.001.

