FIGURE 5.
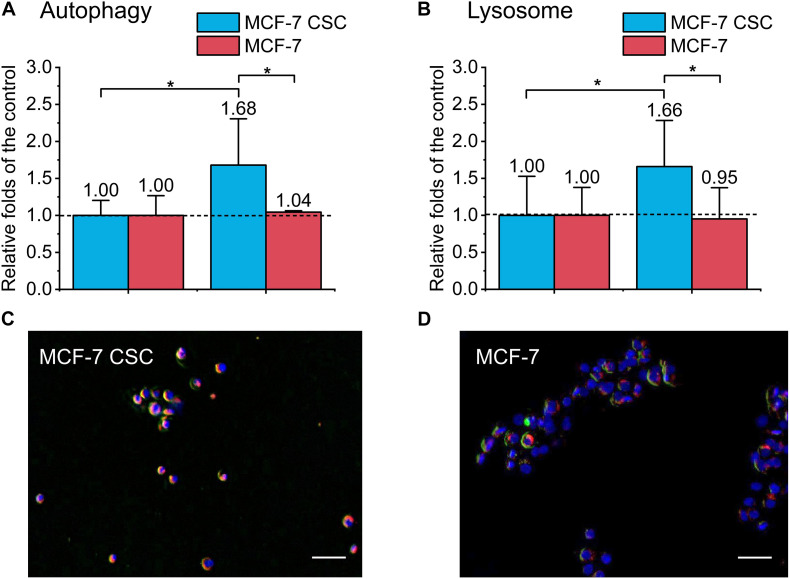
Detection of autophagy and lysosome of irradiated MCF-7 cells and MCF-7 CSCs. (A) Compared with the control, the increasement of autophagy proportion for irradiated group. (B) Compared with the control, the increasement of lysosome for irradiated group. (C,D) Representative images of irradiated MCF-7 cells and MCF-7 CSCs stained with MDC autophagy detection kit and lysoTracker Red DND-99. The blue was the nucleus, the red was the lysosome, and the green labeled autophagy. Scale bars: 50 μm. *P < 0.05.

