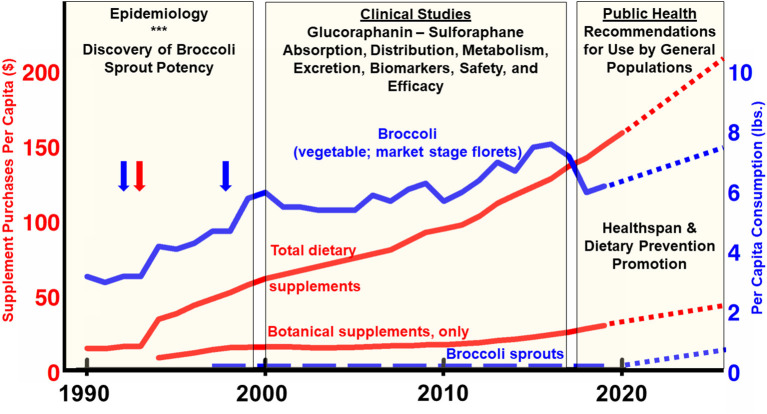
Figure 5.
USA consumption per capita between 1990 and 2020. Broccoli per-capita consumption figures reported by USDA Economic Research Service in pounds (blue line; right axis) (103). Blue vertical arrows align with time of first discovery of sulforaphane and description of some of its benefits (3) and of broccoli sprouts (5). The red vertical arrow aligns with the 1994 enactment of DSHEA (the Dietary Supplement and Education Act) which provided a huge stimulus to the supplement industry. Broccoli sprout consumption is imputed, based on our best estimates since no reliable market data exists (dashed blue line; right axis). Since weight-or mass-based metrics would be a meaningless comparison for dietary supplements, total sales (dollar value), and botanical (herbal) supplement sales, are normalized to the US population over the time periods for which data was available (red lines; left axis) (104), and the botanical supplement data break-out came from the American Botanical Council (105, 106). Sales of glucoraphanin, sulforaphane, and broccoli seed- and sprout-rich extracts are a fraction of this magnitude, but no reliable market data exists. All dotted lines for times beyond 2020 are editorial “best guesses”.

