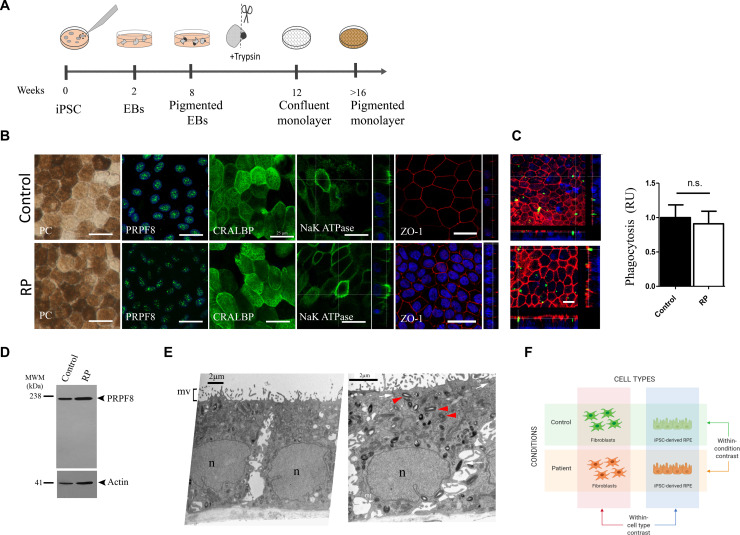
FIGURE 1.
Generation of iPSC-RPE cells from patient and control. (A) Schematic of iPSC differentiation toward RPE. (B) Characterization of iPSC-RPE. Bright-field images of iPSC-RPE monolayers. Immunocytochemistry to PRPF8 and characteristic RPE markers CRALBP, Na+/K+-ATPase (Na/K), and ZO-1. Vertical simulation sections for Na+/K+ ATPase show mainly apical distribution and ZO-1 showing typical apical lateral junction distribution. (C) POS phagocytosis assay: FITC-labeled POS (green); F-actin is stained by phalloidin (red) to visualize cell morphology and internalization of POS and quantitative analyses of ingested POS. (D) Western blot analysis of PRPF8. (E) Transmission electron microscopy of patient iPSC-RPE. Left panel: cuboid polarized RPE cell organized in monolayer with basally located nucleus (n) and apically distributed microvilli (mv). Right panel: RPE cells show melanin granules (red arrowheads) apically from the nucleus, intercellular junctional complexes that include the tight junctions, adherens junctions (arrows), and membrane interdigitations (arrowheads), and basally positioned nucleus (n). (F) Contrasts analyzed by RNA-Seq. Created with BioRender (https://biorender.com/). Data are expressed as means ± SD, n = 3 assays from two differentiation experiments; Student’s t test, n.s., non-significant. Scale bar 25 μm where not indicated.

