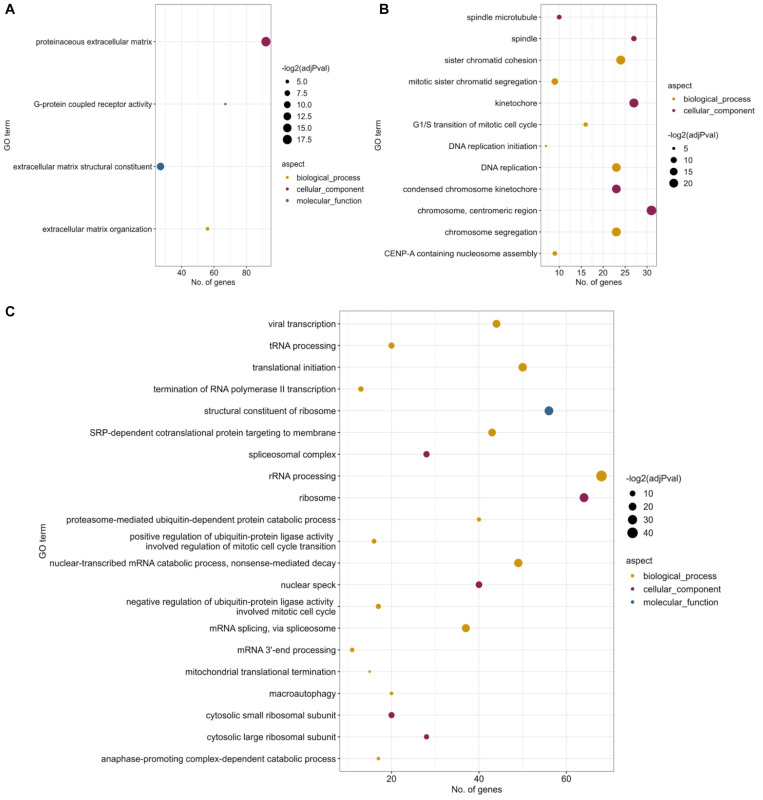
FIGURE 2.
Functional enrichment results for differential gene expression. Significantly enriched (FDR < 0.05) Gene Ontology terms for (A) Patient-RPE vs. Control-RPE contrast, filtering genes that are DE between patient and control fibroblasts. (B) Patient-RPE vs. Patient-fibroblasts, filtering genes that are DE in the control contrast, and (C) Control-RPE vs. Control-fibroblasts, filtering genes that are DE in the disease contrast. Dot size indicates significance of the Fisher’s Exact Test [–log(adj p value)], x-axis position indicates the number of DE genes that are annotated for each significant GO term, and dot color indicates the GO aspect under which the term is annotated.

