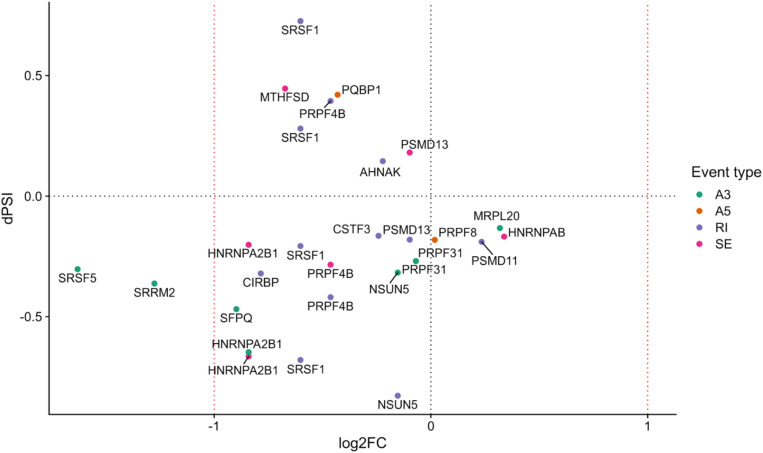
FIGURE 5.
Splicing-related genes with at least one differentially spliced event (p value <0.05) in the Control-RPE vs. Patient-RPE contrast (only genes unique to the RPE contrast are considered). Each event is colored by type (A3, alternative 3′ site; A5, alternative 5′ site; RI, retained intron; SE, skipped exon). dPSI is shown in the y-axis (dPSI < 0: event inclusion favored in control, bottom panel; dPSI > 0: event inclusion favored in patient, upper panel). log2(Fold Change) is shown in the x-axis (FC < 0: gene downregulated in patient, left panel; FC > 0: gene upregulated in patient, right panel).

