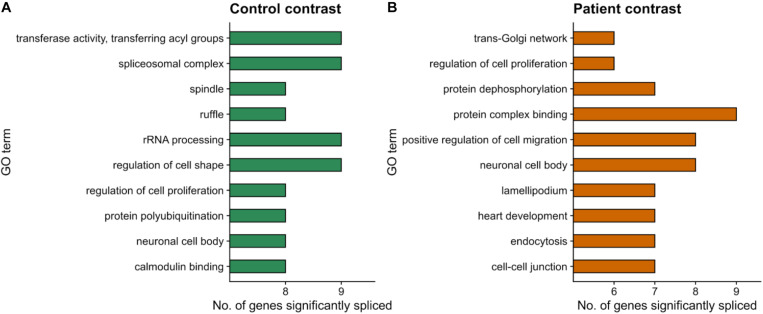
FIGURE 7.
Functional enrichment results for differentially spliced genes (p value <0.05) in the within-condition contrasts. (A) Control-fibroblasts vs. Control-RPE. (B) Patient-fibroblasts vs. Patient-RPE. Only events unique to each contrast are considered. The top-10 most frequently annotated GO terms are shown in the y-axis. The number of genes belonging to each GO term is indicated by bar height (x-axis).

