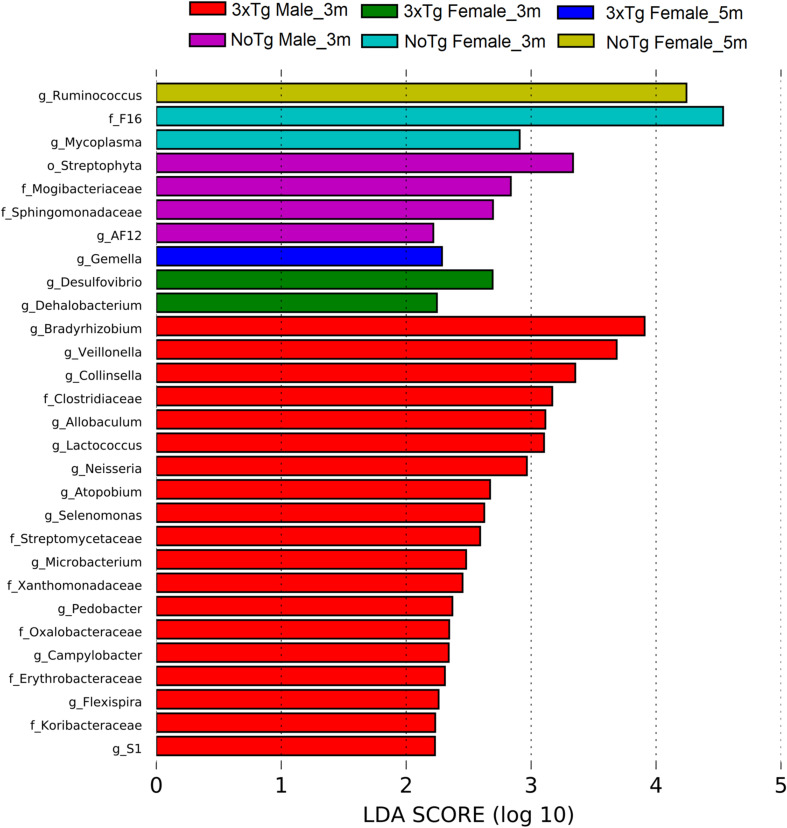
FIGURE 11.
Bacteria with a statistically significant change between non-transgenic (NoTg) and Alzheimer’s disease triple-transgenic (3xTg-AD) mice at 3 and 5 months (m) old in male and female in fecal samples. The bacteria with statistical relevance are shown by colors: red color indicates 3xTg-AD male at 3 months old; green, 3xTg-AD female at 3 months old; blue, 3xTg-AD female at 5 months old; pink, NoTg male at 3 months old; cyan, NoTg female at 3 months old; light olive, NoTg female at 5 months old. Horizontal bars represent the effect size for each taxon. The length of the bars represents the log10 transformed linear discriminant analysis (LDA) score, indicated by vertical dotted lines. The threshold on the logarithmic LDA score for discriminative features was set to 2.0. The name of bacteria with a statistically significant change in the relative abundance is written alongside the horizontal lines. Taxa names are abbreviated as “o,” order; “f,” family, and “g,” genus. See Supplementary Table 5 for full taxon description and LDA score and p values.

