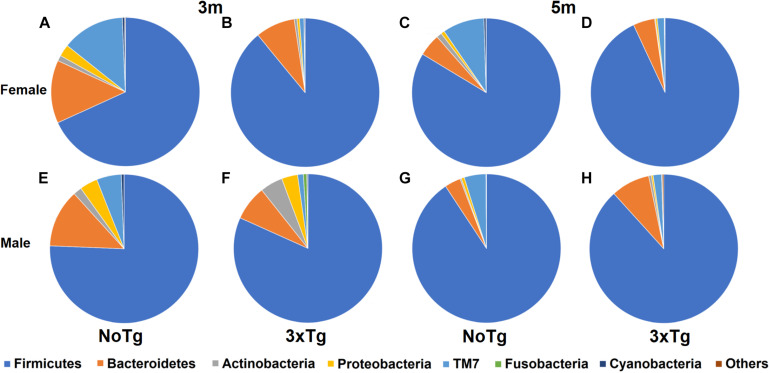
FIGURE 5.
Relative abundance of bacterial phyla in fecal samples of non-transgenic (NoTg) and Alzheimer’s disease triple-transgenic (3xTg-AD) mice. Sectors in pie charts indicate Firmicutes, Bacteroidetes, Actinobacteria, Proteobacteria, TM7, Fusobacteria, and Cyanobacteria phyla as shown by tag colors at the right side of the figure. Abundances of each phylum are shown as percentages beside each sector in the pie charts. “Others” groups phyla with <0.5% relative abundance (Verrucomicrobia, Acidobacteria, Thermotogae, Chloroflexi, Thermi, Gemmatimonadetes, Tenericutes, Euryarchaeota, FBP, Spirochaetes, and Synergistetes). The figure shows data for 3 and 5 months (m) old for NoTg female (A,C) and male mice (E,G) and for 3xTg-AD female (B,D) and male mice (F,H) (Supplementary Tables 1, 2).

