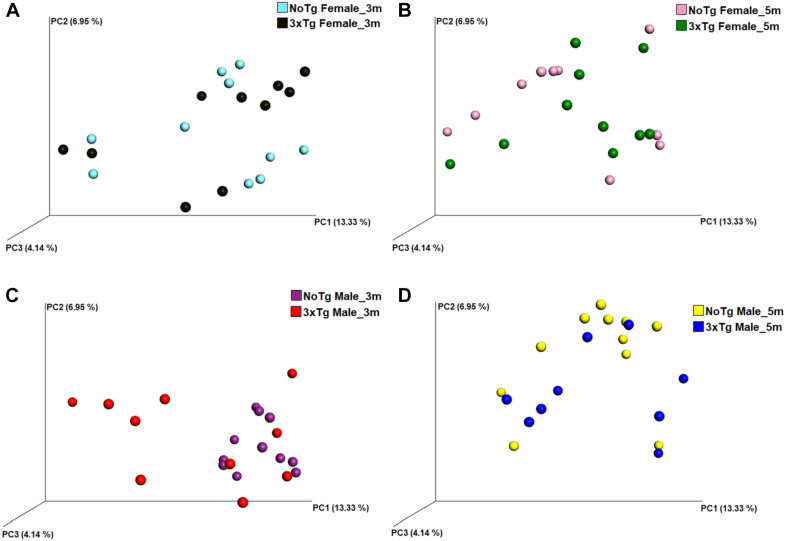
FIGURE 8.
Beta diversity of bacteria in fecal samples collected from non-transgenic (NoTg) and Alzheimer’s disease triple-transgenic (3xTg-AD) mice. The graphics show beta diversity analyses calculated by dissimilarity metrics using operational taxonomic unit (OTU) tables and Unweighted UniFrac analyses. The analyses show the dissimilarity among mice by colors: NoTg female at 3 months (m) old (cyan), 3xTg-AD female at 3 months old (black), NoTg female at 5 months old (pink), 3xTg-AD female at 5 months old (green), NoTg male at 3 months old (purple), 3xTg-AD male at 3 months old (red), NoTg male at 5 months old (yellow), 3xTg-AD male at 3 months old (blue). Data comparisons by genotype and sex: NoTg vs. 3xTg-AD female mice at 3 months old (A), NoTg vs. 3xTg-AD female mice at 5 months old (B), NoTg vs. 3xTg-AD male mice at 3 months old (C), and NoTg vs. 3xTg-AD male mice at 5 months old (D). The three-dimensional scatter plots were generated using principal coordinates analyses (PCoA) in three different axis that show the percentage of total differences. There were significant differences on all comparisons according to ANOSIM similarity test ((A), R = 0.184, p = 0.018; (B), R = 0.124, p = 0.028; (C), R = 0.422, p = 0.001; (D), R = 0.174, p = 0.022).

