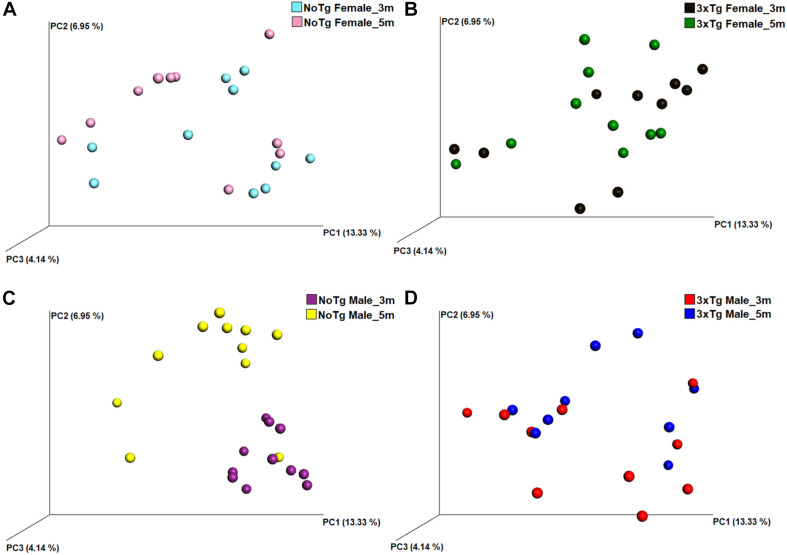
FIGURE 9.
Beta diversity of bacteria in fecal samples collected from non-transgenic (NoTg) and Alzheimer’s disease triple-transgenic (3xTg-AD) mice. The graphics show beta diversity analyses calculated by dissimilarity metrics using operational taxonomic unit (OTU) tables and Unweighted UniFrac analyses. The analyses show the dissimilarity among mice by colors: NoTg female at 3 months (m) old (cyan), 3xTg-AD female at 3 months old (black), NoTg female at 5 months old (pink), 3xTg-AD female at 5 months old (green), NoTg male at 3 months old (purple), 3xTg-AD male at 3 months old (red), NoTg male at 5 months old (yellow), 3xTg-AD male at 3 months old (blue). Data comparisons by time in the same genotype: NoTg female mice 3 and 5 months old (A), 3xTg-AD female mice 3 and 5 months old (B), NoTg male mice 3 and 5 months old (C), and 3xTg-AD male mice 3 and 5 months old (D). The three-dimensional scatter plots were generated using principal coordinates analyses (PCoA) in three different axis that show the percentage of total differences. There is a significant difference in panel (C) according to ANOSIM similarity test (R = 0.425, p = 0.002) but not in panels (A) (R = 0.032, p = 0.223), (B) (R = 0.020, p = 0.297), and (D) (R = 0.093, p = 0.076).

