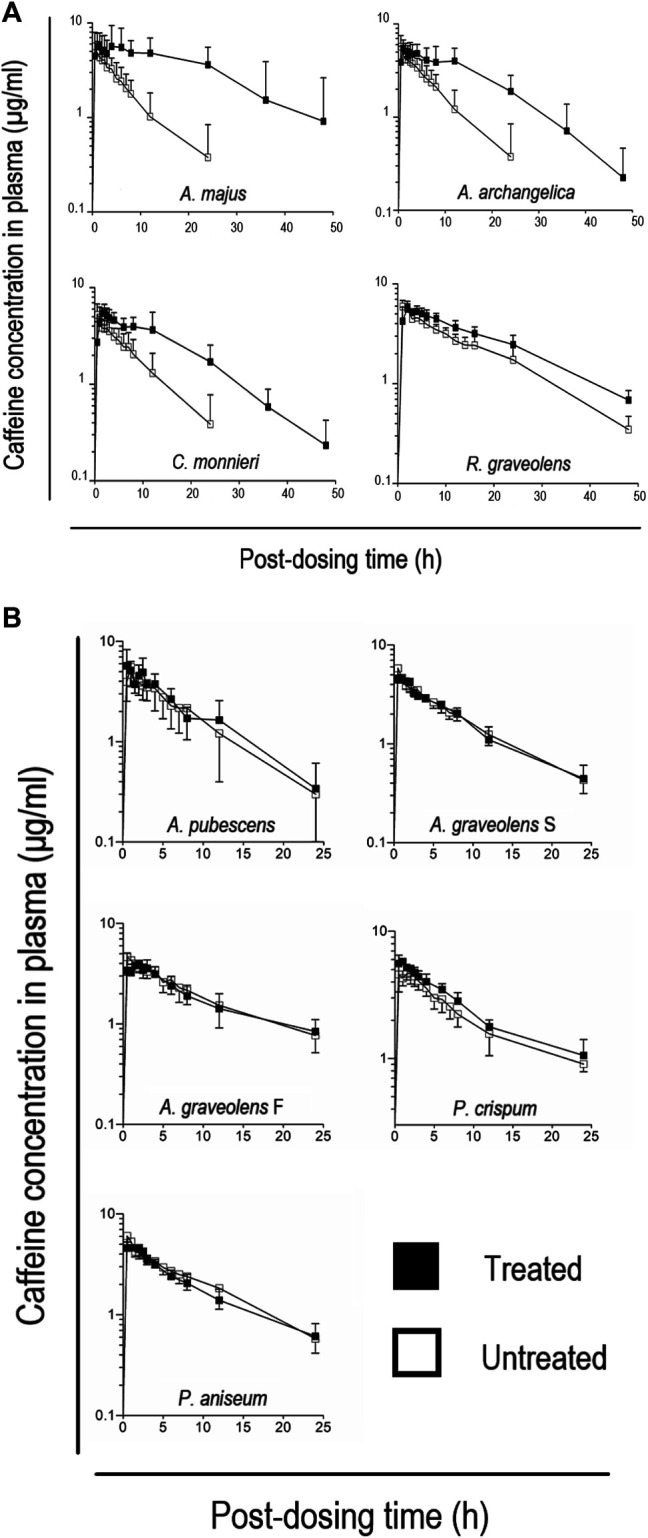
FIGURE 3.

(A) Time course of caffeine concentration in the plasma of volunteers before and after pre-treatment with an extract of A. majus, A. archangelica, C. monnieri, and R. graveolens. Each point is plotted as mean ± SD. Empty squares represent caffeine concentrations in volunteers with no ARFP extract pre-treatment. Filled squares represent caffeine concentrations in volunteers with ARFP extract pre-treatment 3.0 h before receiving the caffeine tablets. (B) Time course of caffeine concentrations in the plasma of volunteers before and after pre-treatment with an extract of P. aniseum, P. crispum, A. pubescens, A. graveolens seeds, and A. graveolens flakes. The point is reported as mean ± SD. Empty squares represent caffeine concentrations in volunteers with no ARFP extract pre-treatment. Filled squares represent caffeine concentrations in volunteers with ARFP extract pre-treatment 3.0 h before receiving the caffeine tablets.
