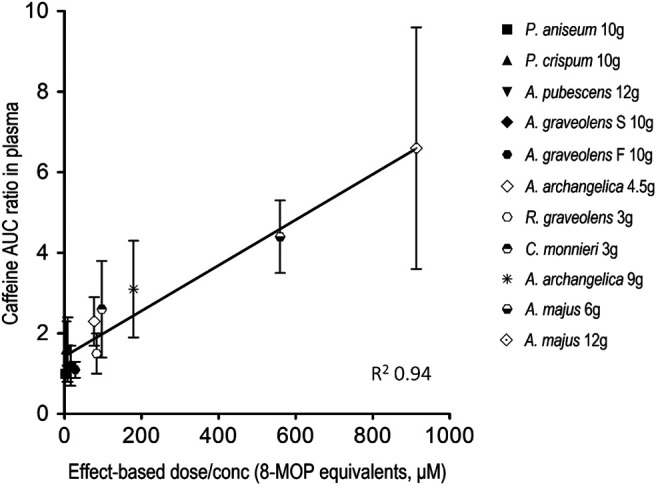
FIGURE 4.

Correlation between the area-under-the-concentration-time-curve (AUC) ratio of caffeine and the effect-based dose measure of the furanocoumarin mixture in ARFP extract. The data represent mean ± SD of caffeine AUC ratio with different effect-based dose measures in the ARFP extracts.
