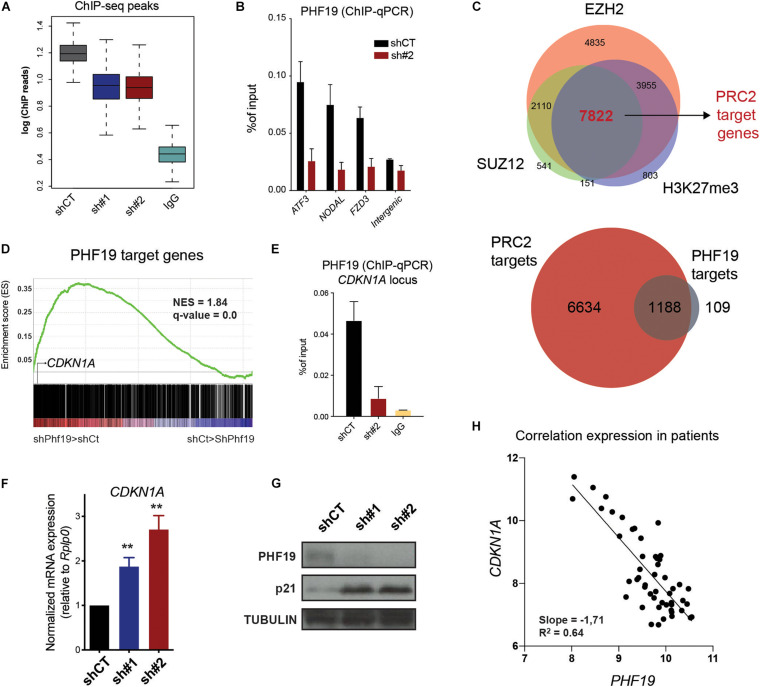
FIGURE 3.
(A) Boxplot of the total number of reads in PHF19 chromatin immunoprecipitation sequencing (ChIP-seq) peaks. (B) PHF19 ChIP enrichment (with respect to the input) measured by qPCR of several genes and intergenic region as a negative control for the cells infected with an empty short hairpin RNA (shRNA, shCT) and a shRNA against PHF19 (sh#2). Mean (n > 2) + SEM. (C) Venn diagrams showing the intersection between the EZH2, SUZ12, and H3K27me3 target genes (top) and between these common targets and PHF19 target genes (bottom). (D) Gene set enrichment analysis (GSEA) showing positive enrichment in the PHF19-depleted transcriptome for the PHF19 target genes. (E) PHF19 ChIP enrichment (with respect to the input) measured by qPCR of the CDKN1A gene for shCT- and sh#2-infected K562 cells, as well as ChIP using IgG in shCT cells. (F) Expression of CDKN1A measured in sh#1- and sh#2-infected K562 cells, measured by qPCR relative to the housekeeping gene RPLP0 and normalized by the expression of shCT-infected cells. Mean (n = 8) + SEM. (G) Western blot for PHF19 and p21 of shCT-, sh# 1-, and sh#2-infected K562 cells 5 days after selection; TUBULIN is used as a loading control. (H) Scatter plot showing the correlation of PHF19 and CDKN1A microarray expression values measured from all bone marrow precursors of chronic myeloid leukemia (CML) patients (cited in the main text). ∗∗p < 0.01.

