FIGURE 4.
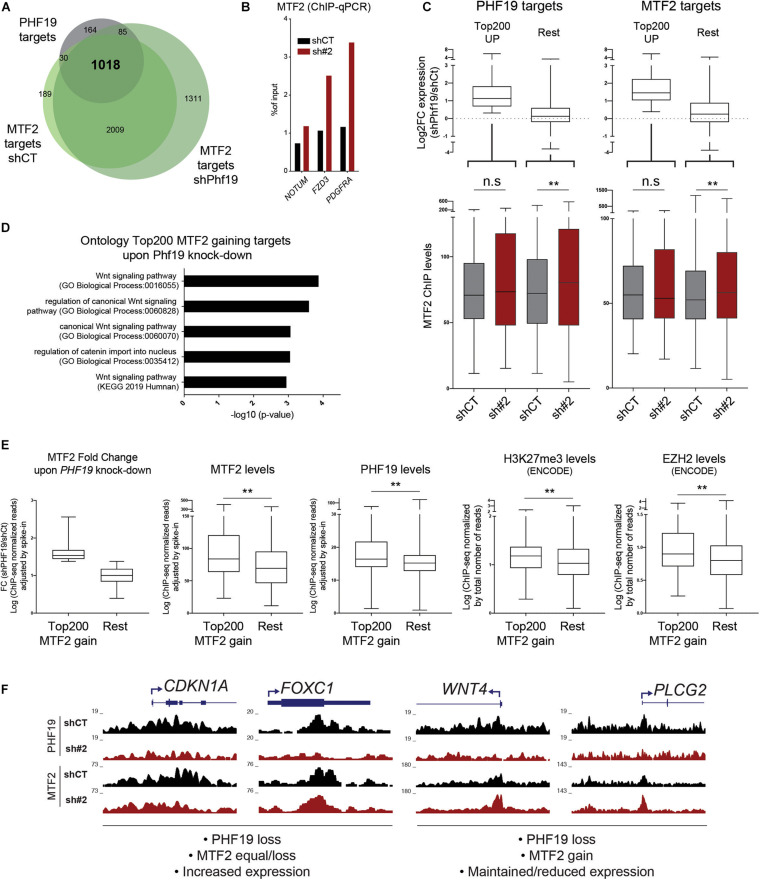
(A) Venn diagram showing the intersection between the PHF19 gene targets and the MTF2 gene targets for cells infected with an empty short hairpin RNA (shRNA, shCT) and a shRNA against PHF19 (sh#2). (B) MTF2 chromatin immunoprecipitation (ChIP) enrichment (with respect to the input) measured by qPCR of several genes and intergenic region as a negative control in shCT- and sh#2-infected K562 cells. (C) Top: Fold change of shPHF19 vs. shCT (Log2) of the top 200 upregulated vs. the rest of the PHF19 (left) and MTF2 (right) gene targets. Bottom: Levels (maximum peak high) of the MTF2 ChIP signal in shCT- and sh#2-infected K562 cells of the top 200 upregulated vs. the rest of the PHF19 (left) and MTF2 (right) gene targets. (D) Gene ontology of the top 200 MTF2 targets that increase their levels upon PHF19 depletion. (E) Characterization of the top 200 MTF2 targets that increase their levels upon PHF19 depletion versus the rest of the MTF2 levels. From left to right: Fold change of MTF2 gain and levels (maximum peak high) of MTF2, PHF19, H3K27me3, and EZH2. (F) Representative screenshots modified from the UCSC Genome Browser. ∗∗p < 0.01.

