FIGURE 5.
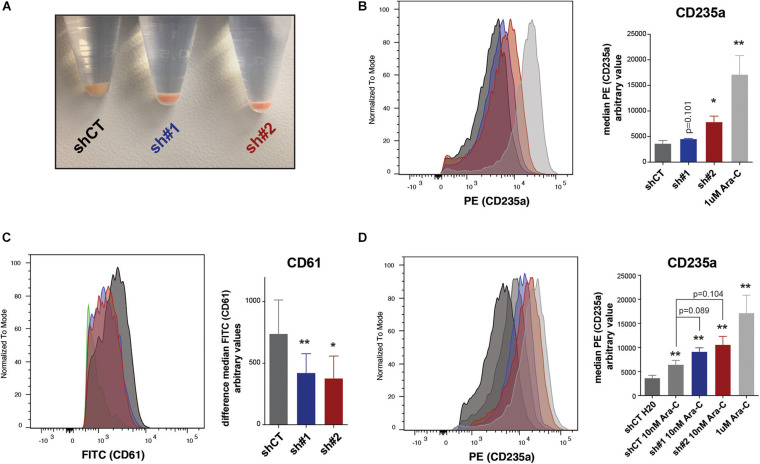
(A) Picture of pelleted K562 infected with an empty short hairpin RNA (shRNA, shCT) and two shRNAs against PHF19 (sh#1 and sh#2) 5 days after puromycin selection. (B) CD235a marker levels measured by flow cytometry in shCT-, sh# 1-, sh#2-infected cells 4 days after puromycin selection and 1 μM of Ara-C treatment in uninfected cells as a positive control. Left, representative plot of a single experiment. Right, bar plot of the mean of median cytometry values (shCt and sh#1, n = 4; sh#1 and 1 μM of Ara-C, n = 3) + SEM. (C) CD61 marker levels measured by flow cytometry in shCT-, sh# 1-, and sh#2-infected cells 4 days after puromycin selection and treated with 1 nM phorbol myristate acetate (PMA) for 24 h. Left, representative plot of a single experiment. Right, bar plot of the mean of median cytometry values (n = 3) + SEM. (D) CD235a marker levels measured by flow cytometry at 4 days in shCT-, sh# 1-, and sh#2-infected cells after puromycin selection and treated with 10 nM of Ara-C for 72 h, with 1 μM of Ara-C treatment in uninfected cells as a positive control. Left, representative plot of a single experiment. Right, bar plot of the mean of median cytometry values (shCt, 10 nM Ara-C; sh#1, 10 nM Ara-C, n = 24; sh#1, 10 nM Ara-C, and 1 μM of Ara-C, n = 3) + SEM.

