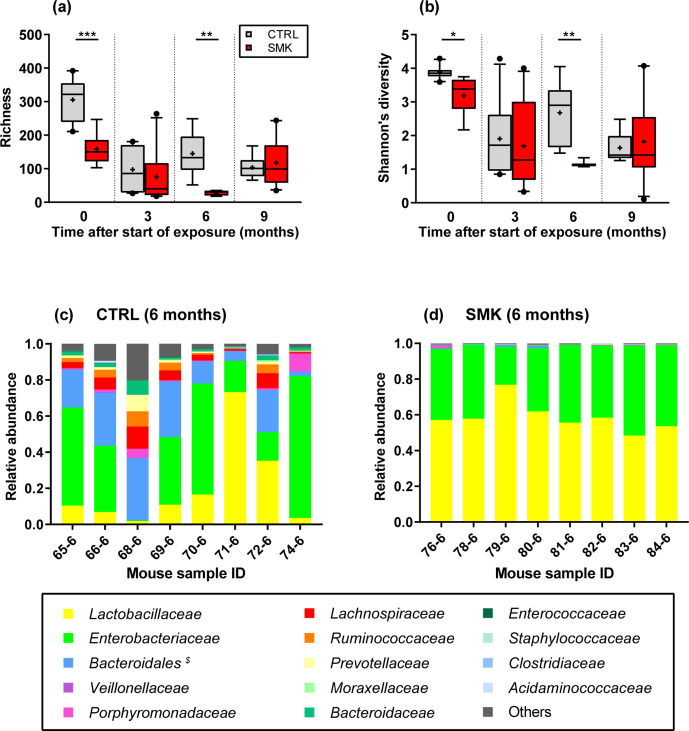
Fig. 2.
Dynamic changes in oropharyngeal microbiota alpha diversity induced by cigarette smoke. (a) Richness and (b) Shannon’s diversity index are shown for CTRL and SMK mice at the indicated time points (see Fig. 1a). Box-plots indicate median and interquartile range with mean indicated by + and with outliers shown. Data are from 8 to 10 mice per group sampled longitudinally and were analysed by two-way ANOVA (*** P <0.001, ** P <0.01, * P <0.05). (c, d) Bacterial genera identified by 16S rRNA sequencing at the 6 month time point are indicated for individual control (CTRL) (c) and smoke-exposed mice (SMK) (d). $ Bacteroidales includes all families of the order except Bacteroidaceae , which are shown separately.

