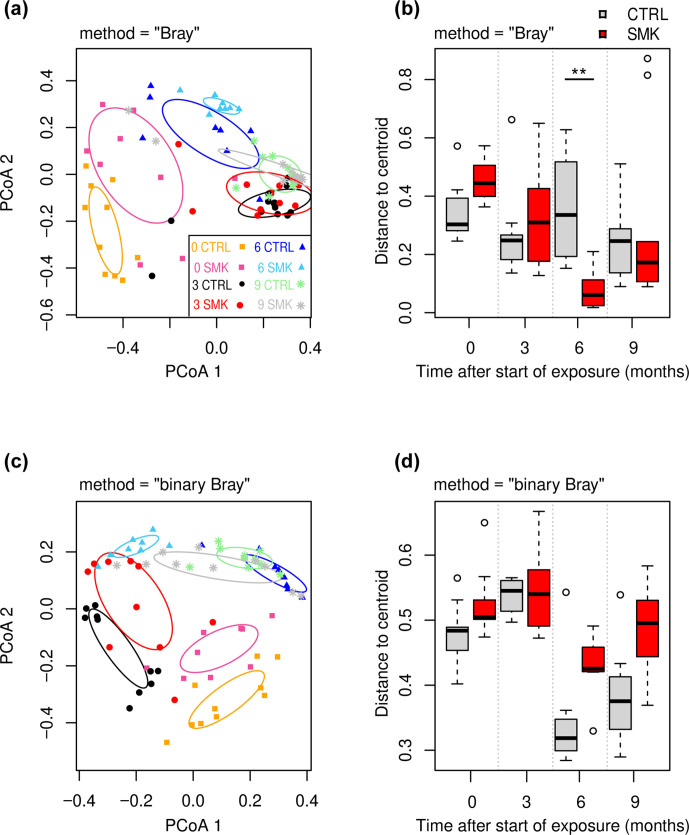
Fig. 3.
Dynamic changes in oropharyngeal microbiota beta diversity induced by cigarette smoke. (a, b) Weighted Bray–Curtis-based PCoA (a) and corresponding beta-dispersion analysis (b) of the microbial composition at indicated time points for SMK and CTRL groups (Fig. 1a). (c, d) Binary Bray–Curtis-based PCoA (c) and beta-dispersion analysis (d). In PCoA (a, c), symbol shapes indicate time points (TP) (squares, 0; circles, 3; triangles, 6; asterisks, 9 months) with CTRL and SMK group-specific colours described in the key. The 1.0 sd data ellipses are plotted for each group. Excluding the samples for TP=0, PERMANOVA P values were P=0.004 (time point), P=0.2 (smoking status) and P=0.5 (smoking status:TP) for data using weighted Bray–Curtis-based PCoA (a). Excluding the samples for TP=0, PERMANOVA P values were P=0.001 (time point), P=0.003 (smoking status) and P=0.02 (smoking status:TP) for data using binary Bray–Curtis-based PCoA (a). (b, d) Distances to centroid determined by beta-dispersion analysis are indicated as box-plots with median, interquartile range and outliers shown. Data are from 8 to 10 mice per group sampled longitudinally. The beta-dispersion data were analysed by Mann–Whitney U test (** P <0.01).

