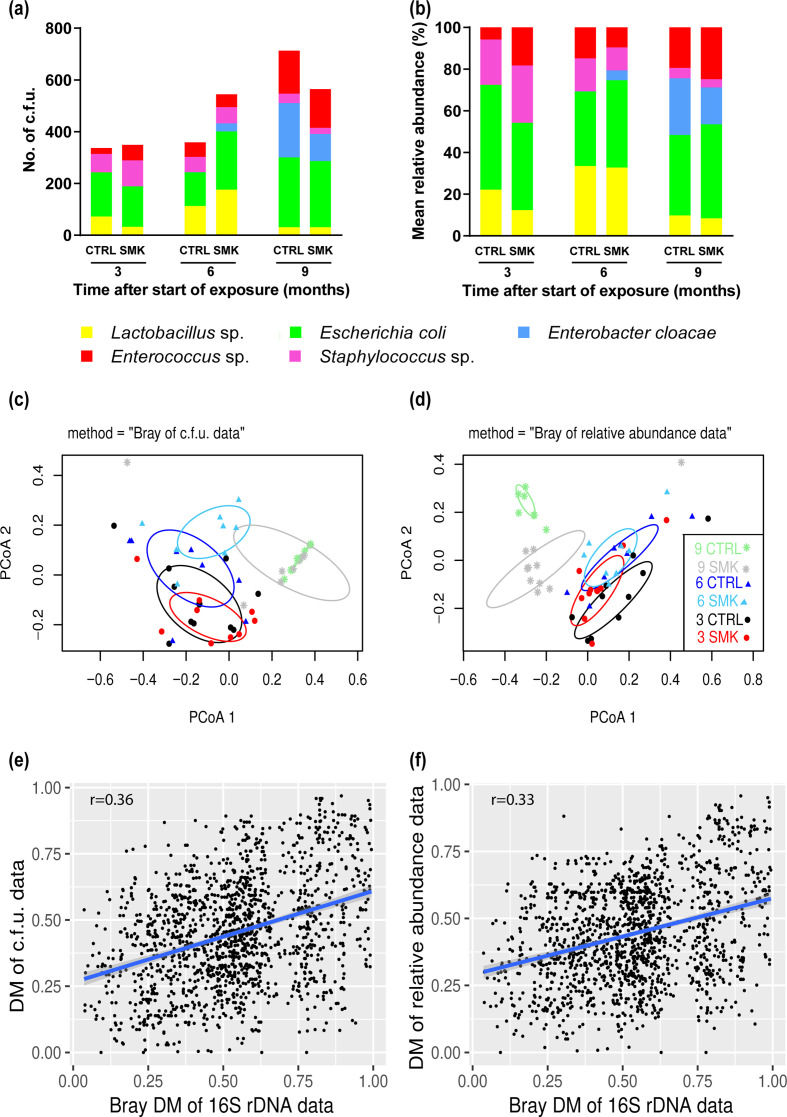
Fig. 4.
Dynamic changes in oropharyngeal bacterial cultures induced by cigarette smoke. (a, b) Mean absolute numbers of c.f.u. (a) and mean relative abundance (b) of bacterial species cultured from the throat swabs of mice exposed to air (CTRL) or cigarette smoke (SMK) at the indicated time points. (c, d) Bray–Curtis-based PCoA of c.f.u. values (c) and relative abundance (d) of bacterial species are shown for SMK and CTRL mice at the indicated time points. Symbol shapes indicate time points (squares, 0; circles, 3; triangles, 6; asterisks, 9) with CTRL and SMK group-specific colours described in the key. Data are from 8 to 10 mice per group sampled longitudinally. (e, f) Regression analysis between the DMs of the microbiota sequencing data and (e) the bacterial c.f.u. values and (f) the relative abundance of bacterial species.

