
Fig. 5.
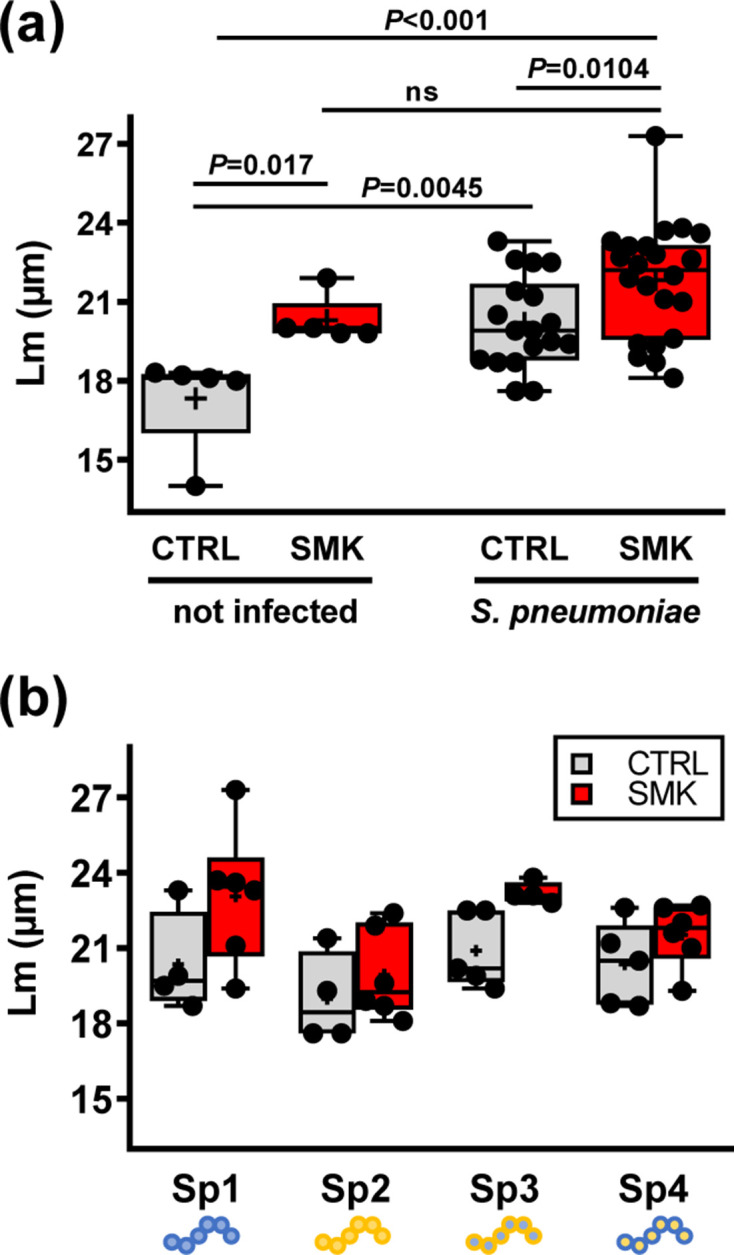
Emphysema in mice exposed to cigarette smoke and pneumococcal infection. Structural analysis of the lung parenchyma was performed at the 9 month time point. (a) Lm of CTRL and SMK groups infected with S. pneumoniae ; data of the 9 month time point of the first experiment are shown for reference (mock). (b) Lm for individual subgroups infected with strains Sp1 (106.66 wild-type, serotype 6B), Sp2 (208.41 wild-type, serotype 7F), Sp3 (106.66 capsule mutant cps208.41, serotype 7F) and Sp4 (208.41 capsule mutant cps106.66, serotype 6B). Scatterplots show data for individual mice; median, interquartile range (box) and mean (+) are shown. Data were analysed by one-way ANOVA. ns denotes for non-significant