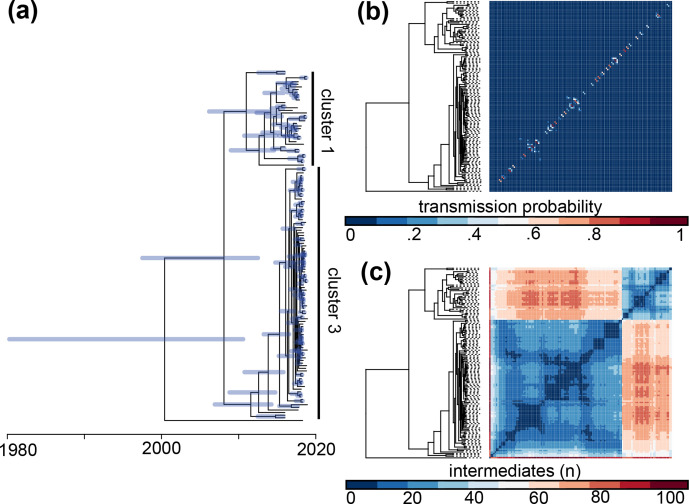
Fig. 3.
Reconstruction of temporal evolution and transmission patterns in the European outbreak. (a) Dated phylogeny of the European outbreak generated with BactDating. Node bars indicate 95 % highest posterior density intervals. (b) Heatmap ordered after the phylogeny showing the posterior probability of direct transmissions between each pair of patients, calculated as the fraction of the transmission trees where the pair is directly connected. (c) Similar heatmap showing the mean number of intermediate individuals between each pair of patients over all the transmission trees.

