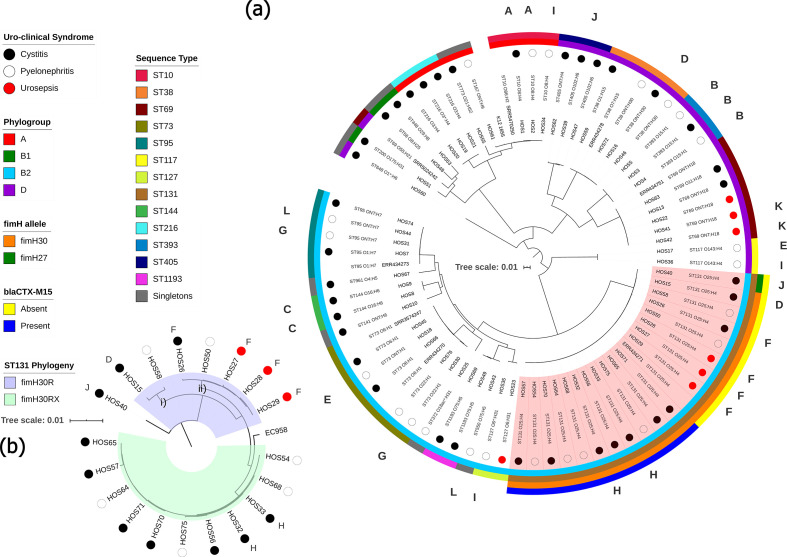
Fig. 2.
Maximum-likelihood phylogenetic trees showing genetic relatedness of ExPEC strains. Tree scale bars represent number of substitutions per site of alignment. (a) Mid-point rooted maximum-likelihood phylogenetic tree, inferred using iq-tree 2 and K12-MG1655 as a reference, containing the 67 ExPEC isolates sequenced in this study. Coloured circles represent uro-clinical syndrome (black, cystitis; white, pyelonephritis; red, urosepsis). The inner-most ring represents the phylogroup (A, red; B1, green; B2, light blue; D, purple). The next ring represents ST. The two outermost rings apply to ST131 isolates only (marked in red shaded area), the inner ring highlights fimH alleles (orange, fimH30; green, H27) and outer ring shows the presence or absence of bla CTX-M-15 (blue, present; yellow, absent). Letters around the perimeter represent multiple isolates taken from a single patient, one letter per patient. (b) SNP-based phylogenetic tree, inferred using iq-tree 2, resolving ST131 isolates into clades. H30R, blue shaded area; H30Rx, green shaded area. Trimethoprim-susceptible ExPEC isolates ERR434278, ERR434751, ERR434270, ERR434273 and ERR434271, and trimethoprim-susceptible EAEC isolates SRR5470250, SRR5024242 and SRR3574247 were added as controls.

