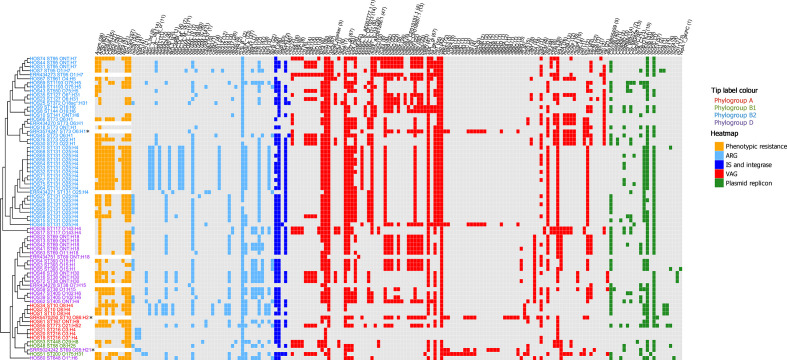
Fig. 4.
Genotypic profile of 73 ExPEC isolates. Tip label colour corresponds to phylogroups (red, A; green, B1; teal, B2; purple, D). The adjacent heatmap represents phenotypic resistances and intact genes present in each isolate (orange, phenotypic resistance; light blue, ARG; dark blue, IS and class 1 and 2 integrase (intI1, intI2); red, VAG; green, plasmid replicon). Along the top of the heatmap, the numbers in brackets after gene names represent the total number of isolates with trait present). Trimethoprim-susceptible ExPEC isolates ERR434278, ERR434751, ERR434270, ERR434273 and ERR434271 and trimethoprim-susceptible EAEC isolates SRR5470250, SRR5024242 and SRR3574247 (marked by asterisks) from other studies were added as controls. The tree on the left side is the maximum-likelihood tree seen in Fig. 2 (reference K12 MG1655 omitted) presented in cladogram form.

