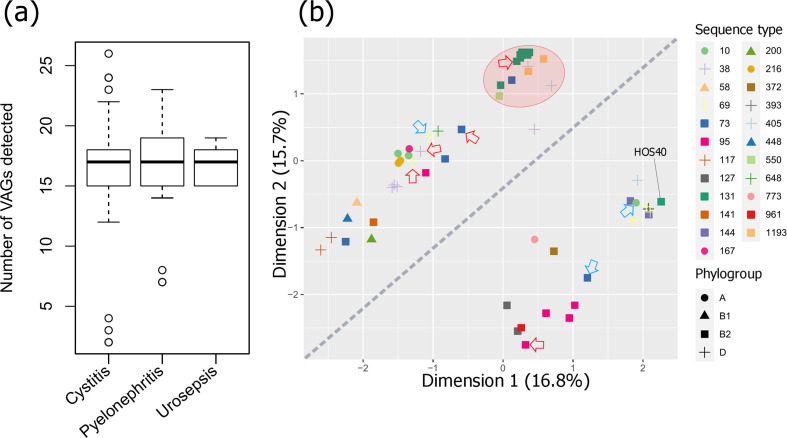
Fig. 7.
Statistical analysis of VAGs detected in the ExPEC collection. (a) Box plot of uro-clinical syndrome versus the number of VAGs. Genes in operons cvaABC(i), eitABCD, papABCDEFGHIJK, aafABCD, aggABCDR and mchBCF were counted as one if at least one gene was present. (b) MDS analysis on detected VAGs. Additional ExPEC isolates sourced from outside this collection are indicated by red arrows, additional EAEC isolates are indicated by blue arrows. The diagonal line splits isolates into a pap gene rich group (below the line) and a pap gene poor group (above the line). The red area highlights the ST131 H30 isolates cluster with two emerging pathogen STs, ST405, ST1193, as well an ST550 isolate and one ST73 isolate. The percentage of total explained variation for each dimension is indicated in parentheses after each axis label.

