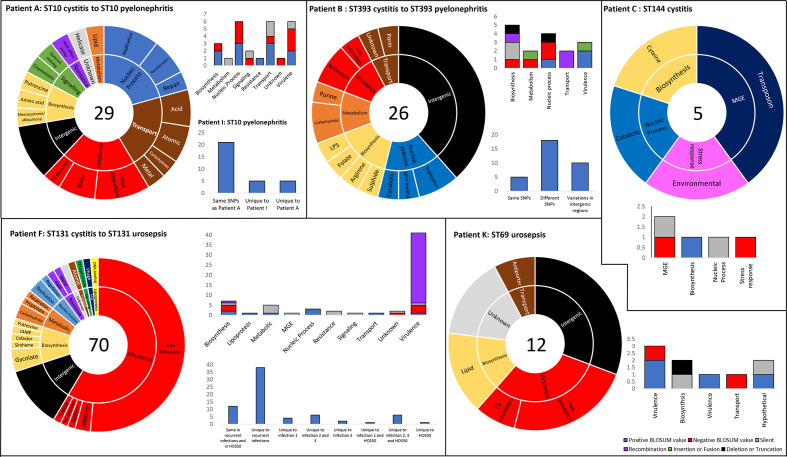
Fig. 9.
Serial patient isolates – SNP distribution and consequence to amino acid sequence. Each panel represents a UTI patient from whom multiple isolates of the same ST were derived. Sunburst graphs represent the distribution of SNPs within functional groups. The number in the centre represents the total number of unique SNPs (accumulative if more than one recurrent infection occurred). Stacked column graphs represent the consequence of SNPs to protein sequence. Color legend for the stacked columns located bottom right corner. Unstacked column graphs represent the distribution of specific SNPs in recurrent infections from the same patient, and in the case of patient A and F, two different patients.

