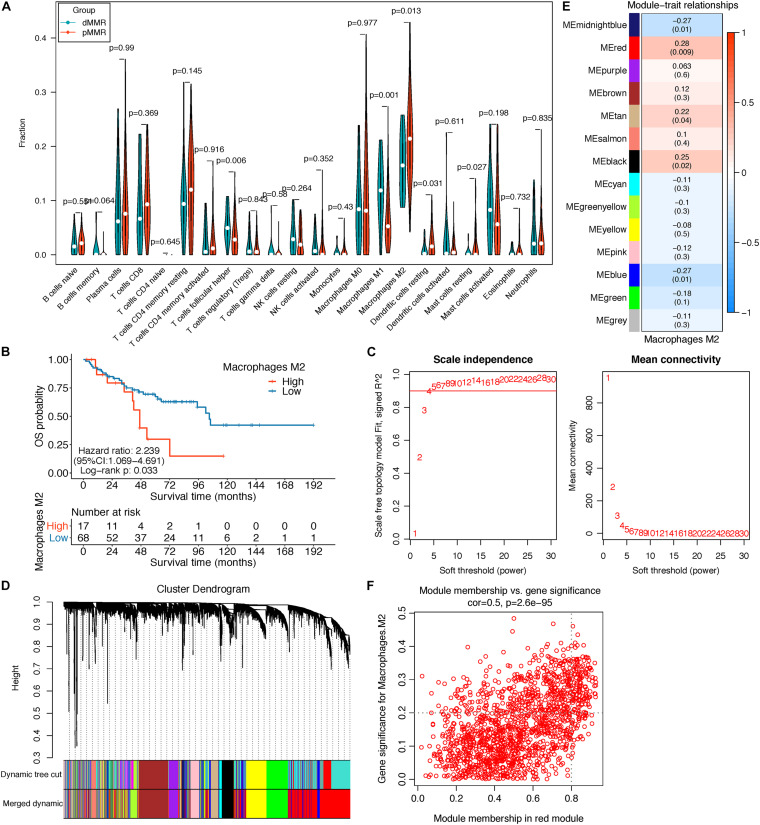
FIGURE 2.
(A) Violin plot displayed the CIBERSORT TIIC fraction difference between pMMR (85) and dMMR (20) stage III/IV CRC samples; only samples with a CIBERSORT P-value < 0.05 were screened for this analysis. (B) Survival curve of the high- and low-M2 macrophage groups in stage III/IV pMMR CRC patients. (C–F) Co-expression network analysis by WGCNA. (C) Analysis of network topology for optimal soft-threshold power. (D) Dendrogram of genes clustered with dissimilarity based on topological overlap; each color below represented an expression module of highly interconnected groups of genes in the constructed gene co-expression network. Gray indicated that genes were not incorporated into any module. (E) Heatmap of the correlation between each module’s module eigengene and M2 macrophage fractions; each cell contains the Pearson’s correlation coefficient and the corresponding P-value. The red module was the most significant module with the strongest correlation. (F) Scatterplot of gene significance (GS) for M2 macrophage fractions vs. module membership (MM) in the red modules. TIICs, tumor-infiltrating immune cells; pMMR, mismatch-repair-proficient; dMMR, mismatch-repair-deficient; CRC, colorectal cancer; WGCNA, weighted gene co-expression network analysis.

