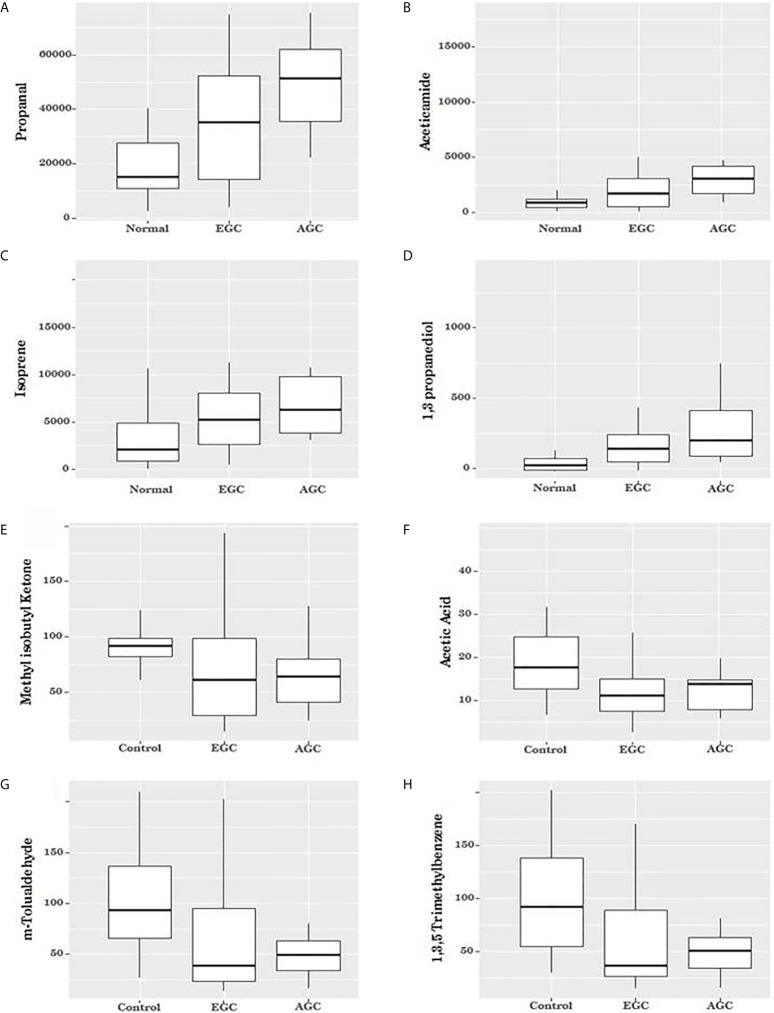
Figure 2.
Box plot for the volatile organic compounds (VOCs) according to cancer status. (A–D) When patients were grouped according to cancer stage, four VOCs were seen to gradually increase as cancer advanced (Propanal, Aceticamide, Isoprene, and 1,3 propanediol, respectively (P = 0.003, P = 0.007, P = 0.020 and P = 0.025, respectively). (E, F) The two the VOCs showed no significant differences among the three groups (methyl isobutyl ketone, P = 0.998 and acetic acid, P = 0.050). (G, H) Two of the VOCs that were lower in cancer patients than in controls showed significant differences among the three groups, but these were not correlated with cancer stage (m-tolualdehyde, P = 0.021, and 1, 3, 5-trimethylbenzene, P = 0.016).

