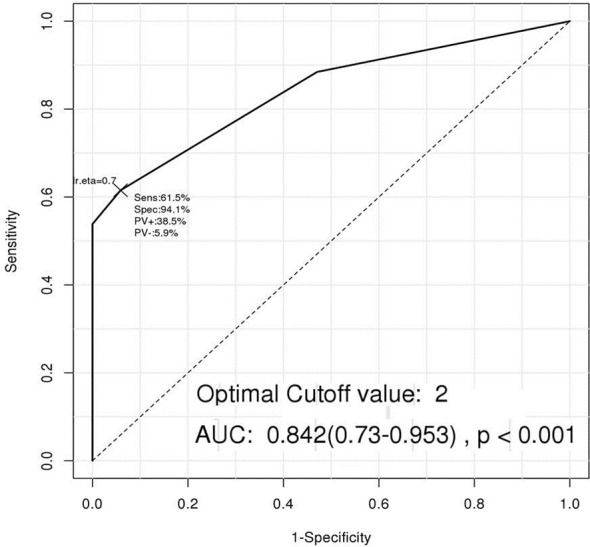
Figure 4.

The Receiver operating characteristic (ROC) curve of a new predicting model including the four volatile organic compounds (VOCs). When a VOC level was higher than its cut-off value, the VOC was defined as positive, and a new ROC curve was constructed based on the positivity status of the four VOCs. This model showed the highest AUC of 0.842 with 61% sensitivity and 94% specificity when more than two VOCs were positive.
