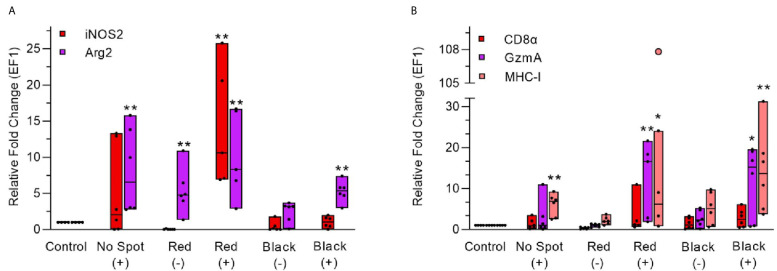
Figure 11.
Gene expression analysis during red and black focal changes in PRV infected (+) and uninfected (-) fish groups. (A) Relative fold change (median line) for each fish group is shown for iNOS2 and Arg2 (left Y-axis). (B) Relative fold change (median line) for each fish group is shown for CD8α, GzmA and MHC-I. Pink dot showing outlier value in the respective group. Each dot within boxes represents individual fish in the group. Gene expression relative to the control group (uninfected and unaffected) fish was normalized against EF1ab. * indicates significantly different from the control group (*p < 0.05, **p < 0.01).

