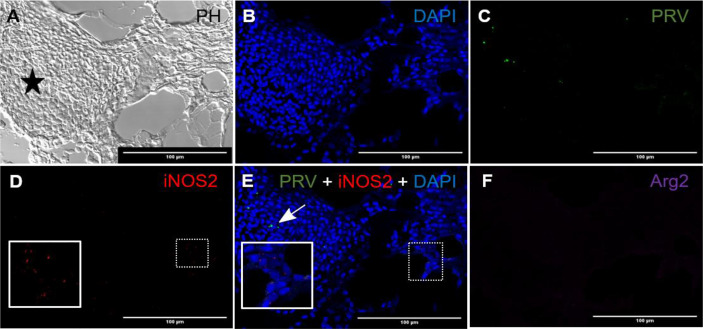
Figure 2.
Fluorescent in situ hybridization of PRV-1, iNOS2 and Arg2 in red focal changes (early phase). (A) Phase contrast image showing a large hemorrhage (star). (B) DNA staining of the cells by DAPI (blue). (C) Presence of a few PRV-1 (green) positive cells in the hemorrhage. (D) iNOS2 (red) specific transcripts detected in a limited number of cells surrounding a peripheral blood vessel. (E) Merged image showing presence of PRV-1 (arrow) but no co-localizing in the M1 macrophage (inset). (F) Arg2 (purple) specific transcripts (M2 type macrophages) were undetected. Scale bar = 100µm.

