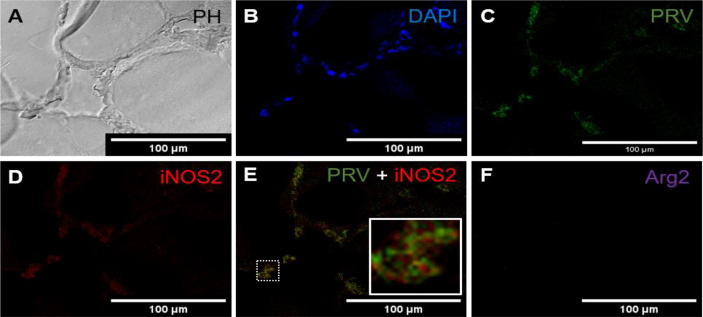
Figure 3.
Fluorescent in situ hybridization of PRV-1, iNOS2 and Arg2 in red focal changes (intermediate phase). (A) Phase contrast image showing infiltrating cells between myocytes. (B) Nuclei DNA staining of the cells with DAPI (blue). (C) Presence of PRV-1 (green) in infiltrating cells in between myocytes. (D) Presence of iNOS2 (red) in infiltrating cells between myocytes. (E) Merged image showing co-localization (inset) of PRV-1 and iNOS2 (yellow). (F) Arg2 transcripts (purple) were not detected. Scale bar = 100µm.

