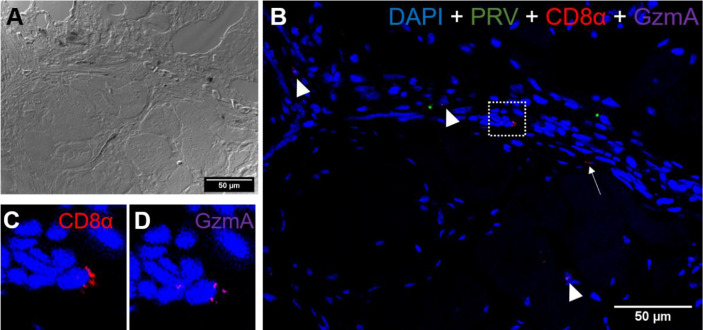
Figure 9.
Fluorescent in situ hybridization of PRV-1, CD8α and GzmA in black focal changes. (A) phase contrast image showing cell structures with melanin accumulation. (B) Merged image showing presence of PRV-1 (green) infected cells with CD8+ cells (red) (arrows) and granzyme A (purple) in another cell population (arrowhead). Dotted rectangle showing co-expression of CD8 and GrzmA split in (C, D). Nuclei DNA stained with DAPI (blue) Scale Bar = 50 µm.

