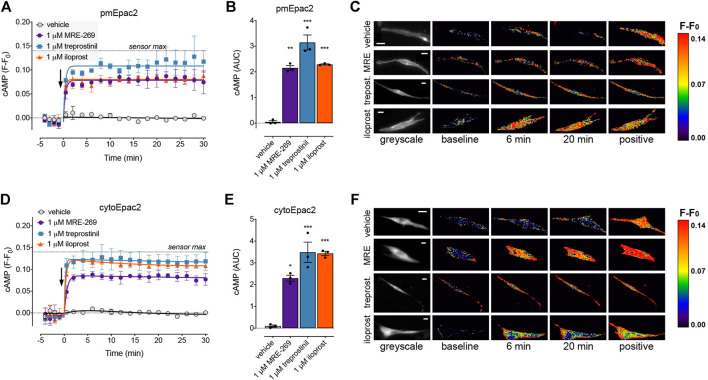
FIGURE 5.
MRE-269, treprostinil, and iloprost all cause sustained increases in plasma membrane and cytosolic cAMP. cAMP was measured at the plasma membrane or in the cytosol of human lung fibroblasts electroporated with the pmEpac2 or cytoEpac2 FRET biosensors, respectively. Cells were stimulated with vehicle control (0.1% v/v DMSO) or a maximal concentration of MRE-269, treprostinil or iloprost (all 1 μM) (n = 3). (A) Time course of cAMP at the plasma membrane. (B) AUC calculated from A. (C) Representative ratiometric pseudocolour images from A. (D) Time course of cAMP in the cytosol. (E) AUC calculated from D. (F) Representative ratiometric pseudocolour images from D. For time course graphs, symbols show the mean and error bars, standard error of the mean. The arrow indicates addition of vehicle or IPR agonist. Maximal FRET change induced by the positive control (forskolin and IBMX) is indicated as a dashed line. For AUC graphs, bars show the mean, symbols the individual data points, and error bars show the standard error of the mean. *p < 0.05, **p < 0.01 and ***p < 0.001 vs. vehicle control, one-way ANOVA with Dunnett’s multiple comparisons test. For ratiometric images, scale bar shows 20 μm. MRE, MRE-269 and treprost., treprostinil.

