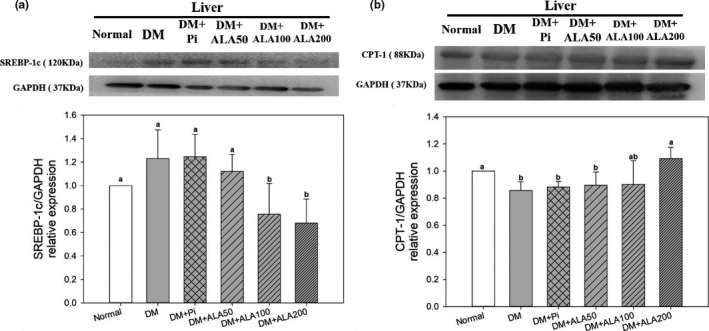
FIGURE 5.

Protein expression levels of SREBP‐1c (a) and CPT‐1 (b) in the livers of high‐fat diet and streptozotocin‐induced type 2 diabetic rats treated with alpha‐lipoic acid for 13 weeks. Abbreviations are as in Figure 1. a‐b letters indicate significant difference among all samples tested (p < .05)
